Graphing Quadratic Inequalities Worksheet
A graphing quadratic inequalities worksheet for Algebra I and II: draw the parabola, decide dashed or solid, then shade the half of the plane that actually works — 20 practice problems and a full answer key.
Published · Last updated · Every answer checked for accuracy before publishing · Free to print for classroom & home use
- Level
- Algebra I and Algebra II, grades 8–12
- Standards
- Extends CCSS.MATH.CONTENT.HSA.REI.D.12, written for linear inequalities, to quadratic boundary curves; also supports HSA.CED.A.3
- Includes
- 20 problems in two parts, four color-coded figures, five graphs to read, and a full answer key with steps
- Time
- About 40–50 minutes for both parts
- Format
- Read on this page or print the PDF — no sign-up
Want the printable graphing quadratic inequalities worksheet?
Graphs, 20 practice problems, and a full answer key. No sign-up, no email required.
Download the PDF worksheetPDF · problems and answer key · prints on letter paper
A quadratic inequality uses a parabola as its boundary and asks which side of that boundary satisfies the inequality. The process has three steps: graph the boundary, decide whether it is dashed or solid, and test a point to determine which region to shade. In tutoring sessions, I see more mistakes with the shading than with drawing the parabola itself.
Swap the inequality sign for an equals sign.
Vertex, then two more points.
The line under the sign means the curve counts.
< or > → dashed.
True → shade that side.
False → shade the other one.
- Read the three cards. They are the whole method.
- Work Part A without notes. Ten problems, about 20 minutes.
- Check Part A against the key before starting Part B.
- Missed one? Redraw it and label the test point you used. Nine times out of ten the shading went wrong, not the parabola.
Worked Example: Graphing a Quadratic Inequality
Take y > x² − 2x − 3. Boundary first: it factors to (x − 3)(x + 1), so the curve crosses at −1 and 3, and the vertex sits at (1, −4). The sign is a plain >, so the curve is dashed. Now test the origin: 0 > −3 is true, so the origin's side gets the shading. Done.
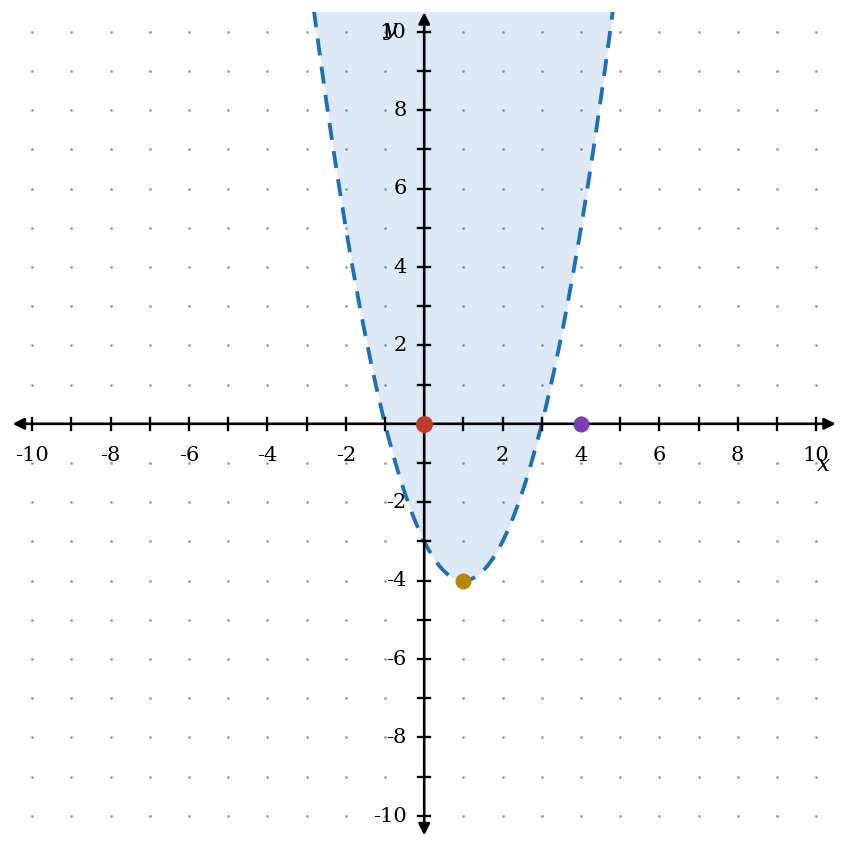
| Color | Piece |
|---|---|
| Blue dashed | y = x² − 2x − 3 |
| Blue shading | every solution |
| Gold | vertex (1, −4) |
| Red | (0, 0): 0 > −3 ✓ |
| Purple | (4, 0): 0 > 5 ✗ |
If drawing the parabola is the part that slows you down, that is a separate skill and worth fixing first so check out the graphing quadratic functions worksheet and the vertex and axis of symmetry worksheet.
Dashed or Solid: One Tiny Line Decides
Use a solid boundary for ≤ or ≥ because points on the parabola are included. Use a dashed boundary for < or > because points on the parabola are excluded.
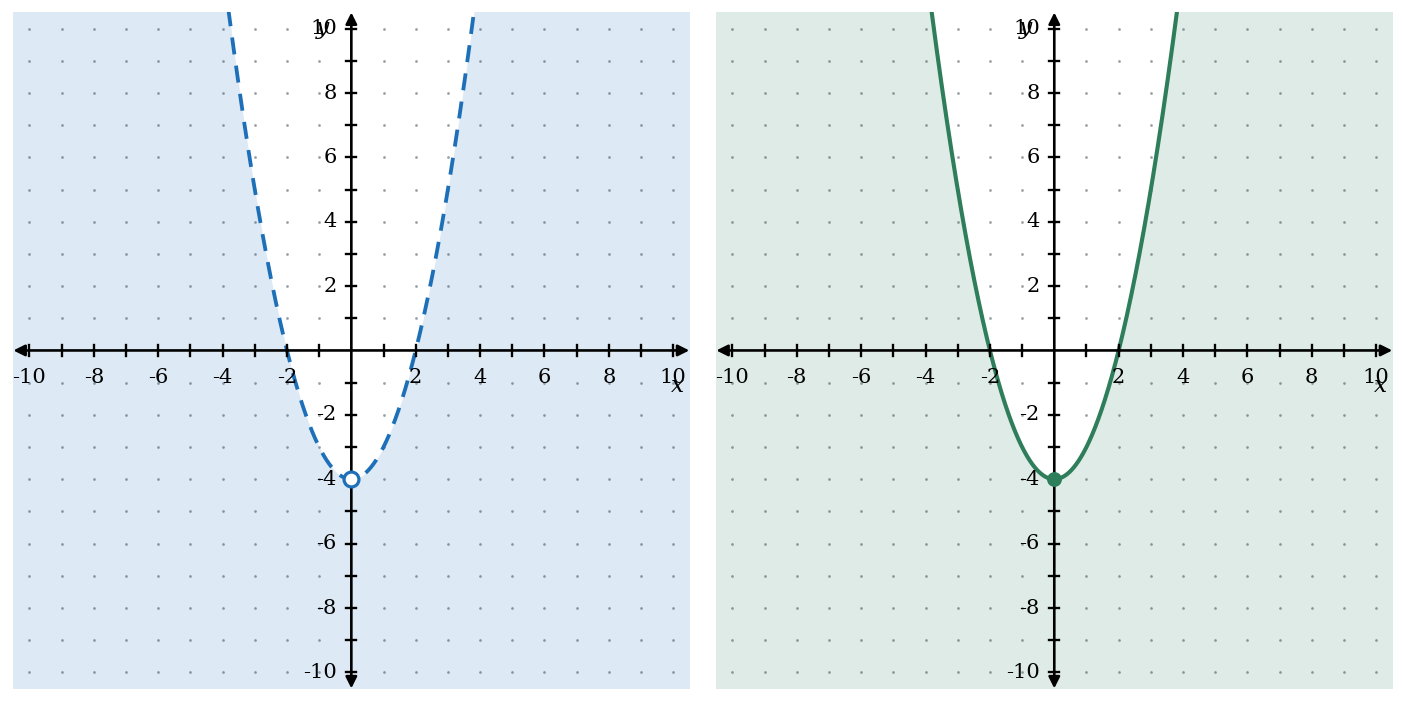
| Color | Inequality |
|---|---|
| Blue dashed | y < x² − 4 |
| Open dot | (0, −4) is not a solution |
| Green solid | y ≤ x² − 4 |
| Filled dot | (0, −4) is a solution |
- A beautiful parabola, the right side shaded — and a solid curve on a strict inequality. Half credit gone over a line style. Before you shade, look at the sign again and be careful.
- Testing a point that sits on the curve. If the dot you pick isn't helping you decide which side to shade then just pick another simpler dot and retry. Pick a dot not on the curve but in either one of the sides of the parabola or line you are working with.
- Shading "up" out of habit on a downward parabola. Up and down are decided by the inequality sign, not by which way the arch points.
Which Side to Shade (Just Test a Point)
Pick any point that is not on the curve — the origin if it's available, since the arithmetic is free. Plug it in. If the statement is true, that point is a solution, so shade its side. If it's false, shade the other one. If the test point makes the inequality true, shade the region containing that point. Otherwise shade the opposite region.
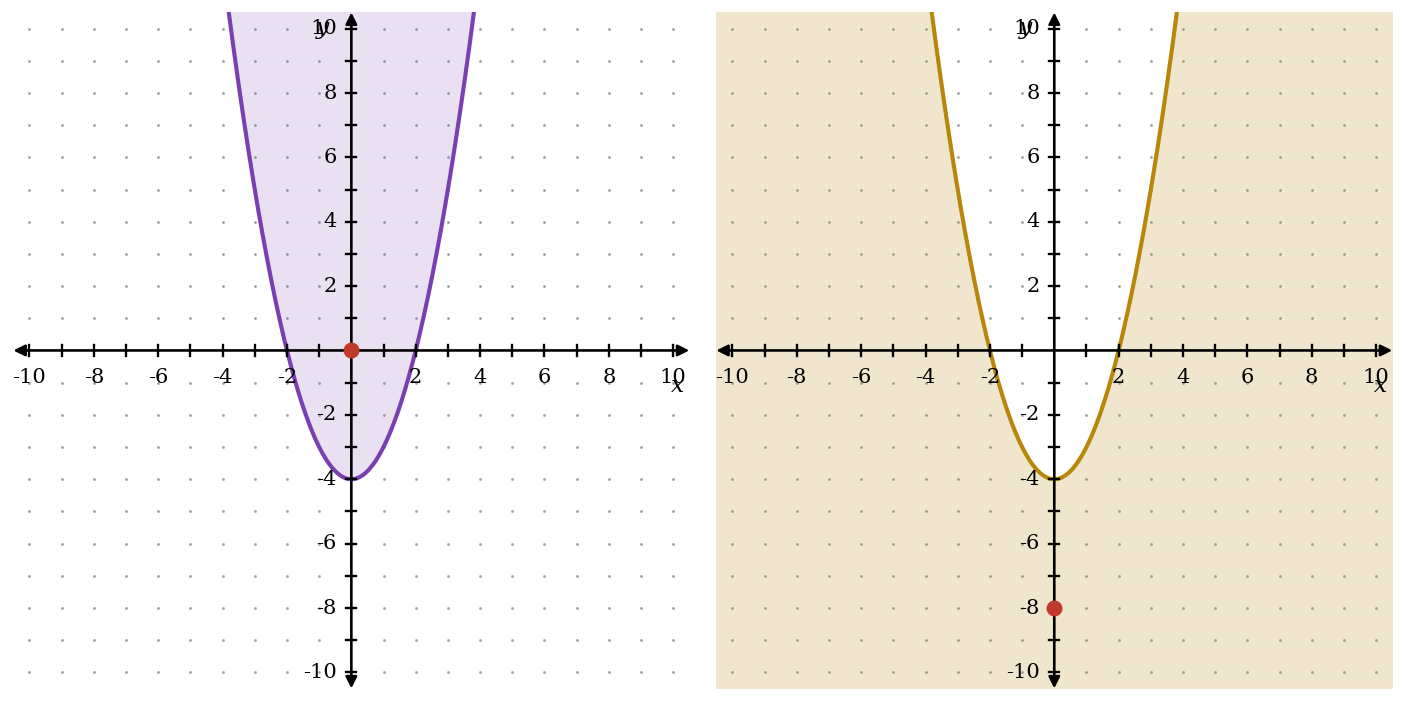
| Color | Inequality and test |
|---|---|
| Purple | y ≥ x² − 4 |
| Red (0, 0) | 0 ≥ −4 ✓ shade inside |
| Gold | y ≤ x² − 4 |
| Red (0, −8) | −8 ≤ −4 ✓ shade outside |
There's a shortcut, and you'll spot it after four or five problems: y > shades above the curve, y < shades below, no matter which way the parabola opens. Use the shortcut on a quiz, but test a point on the homework, because this shortcut only applies when the inequality is already solved for y. Otherwise, use a test point. Paul's Online Notes on polynomial inequalities handles that one-variable version if you want to see the difference side by side.
Going Backwards: Writing the Inequality From a Graph
Same three steps, reversed, and it takes longer than you think. Here's one worked all the way through.
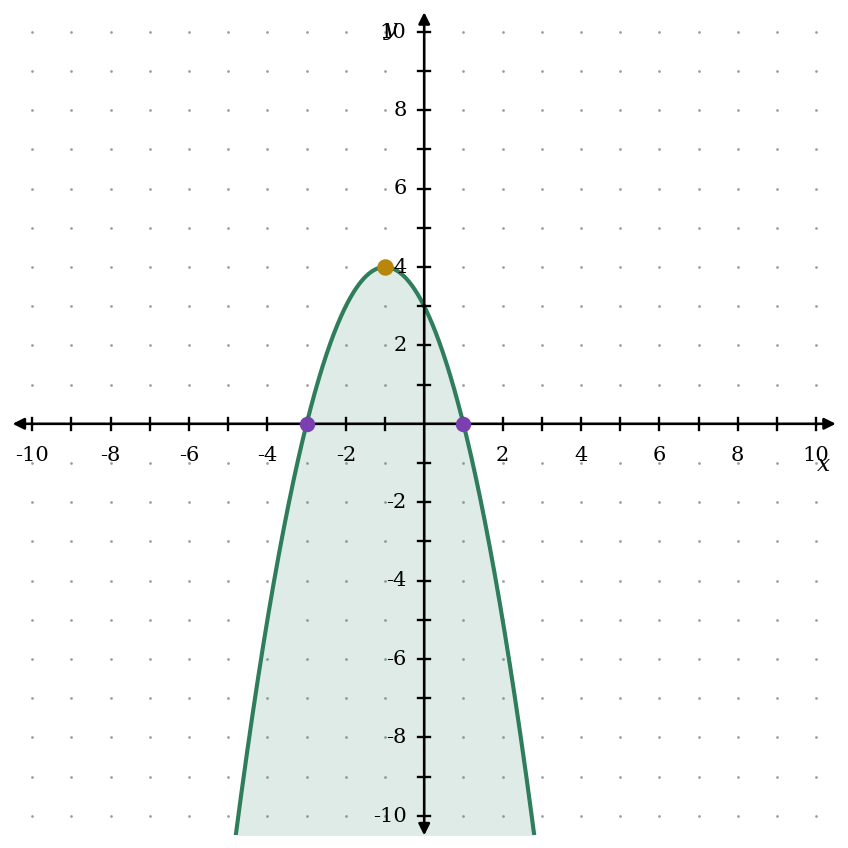
| Read | Get |
|---|---|
| Gold vertex | (−1, 4) |
| Purple points | (−3, 0) and (1, 0) |
| Solid curve | ≤ or ≥ |
| Shaded below | y ≤ −(x + 1)² + 4 |
Where did the −1 out front come from? Vertex form says y = a(x + 1)² + 4, and the curve passes through (1, 0), so 0 = 4a + 4 and a = −1. If that step feels shaky, the vertex form and intercept form worksheet and writing a parabola's equation from a graph drill exactly that move.
Want to try it out? Type an inequality straight into the Desmos graphing calculator or GeoGebra's graphing tool and drag the numbers around. I usually have students type one of the inequalities into Desmos after the first worked example and change the inequality sign to see what happens to the boundary and shading. For a second explanation in different words, Third Space Learning's shading-regions guide and Math Warehouse's quadratic inequality walkthrough both take a different run at it.
Practice Problems: Graphing Quadratic Inequalities
Part A gives you the inequality and wants the graph. Part B gives you the graph and wants the inequality. For Part A, state the vertex, whether the curve is dashed or solid, and which region you shaded — then sketch it.
Part A — graph the inequality
- y > x² − 4
- y ≤ x² + 2x − 3
- y < −x² + 4
- y ≥ (x − 2)² − 1
- y < x² − 6x + 5
- y ≥ −(x + 1)² + 4
- y > x² − 2x
- y ≤ −x² − 4x − 3
- y < (x + 3)² − 2
- y ≥ 2x² − 8x + 6
Part B — write the inequality, then answer the question
-
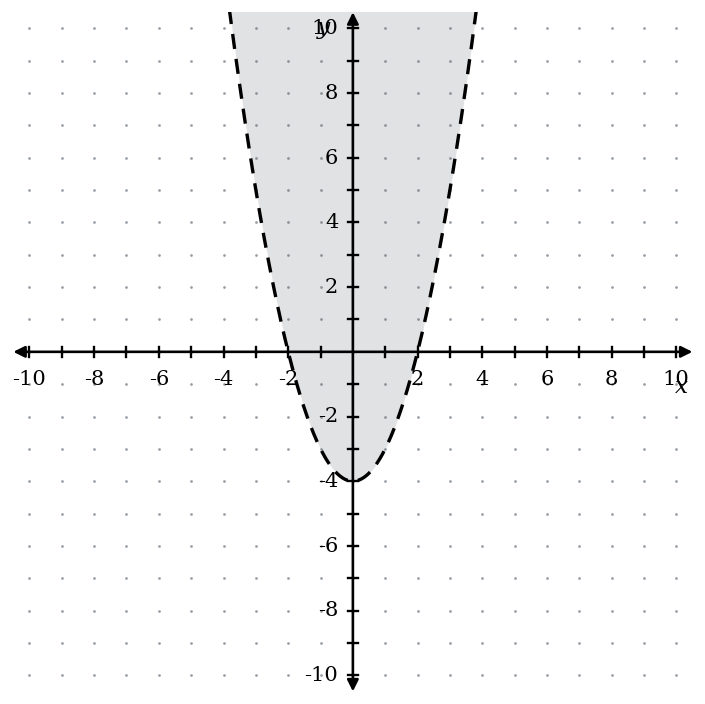
Write the inequality shown.
-
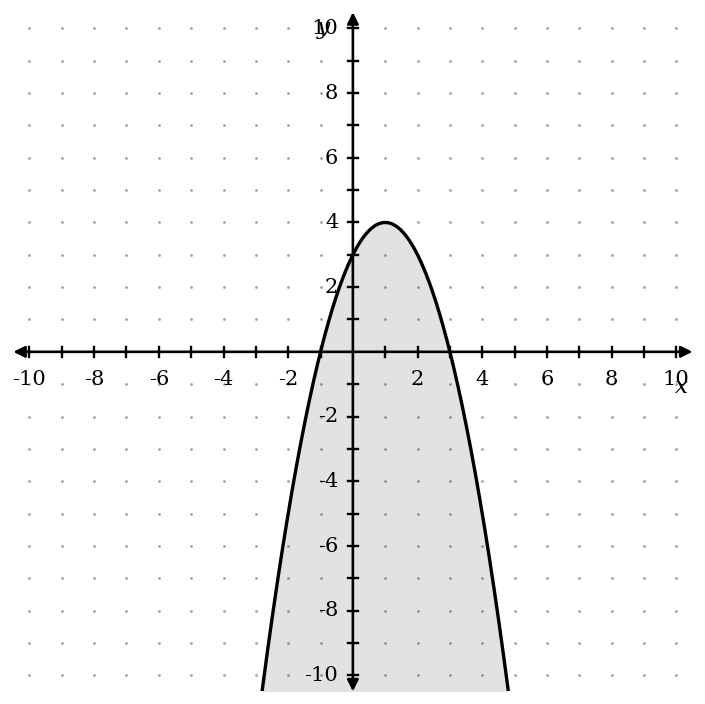
Write the inequality shown.
-
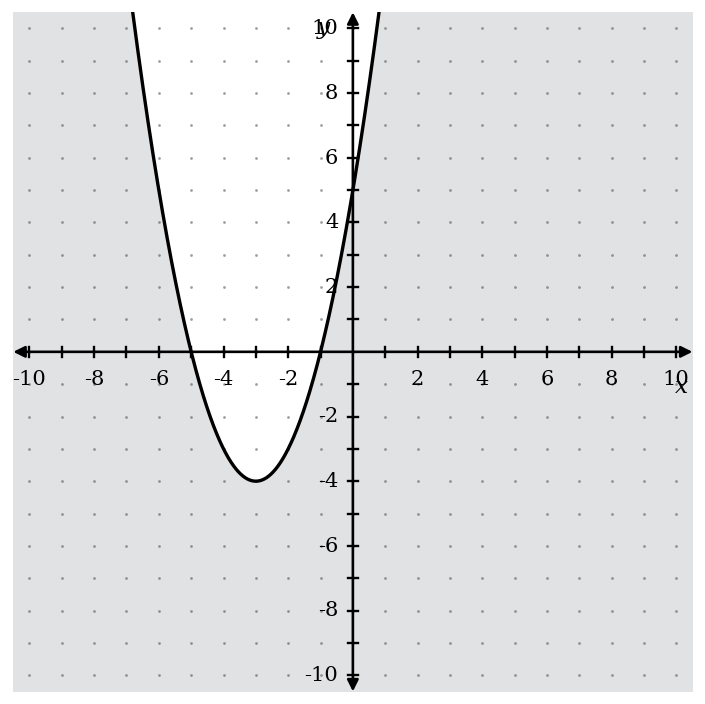
Write the inequality shown.
-
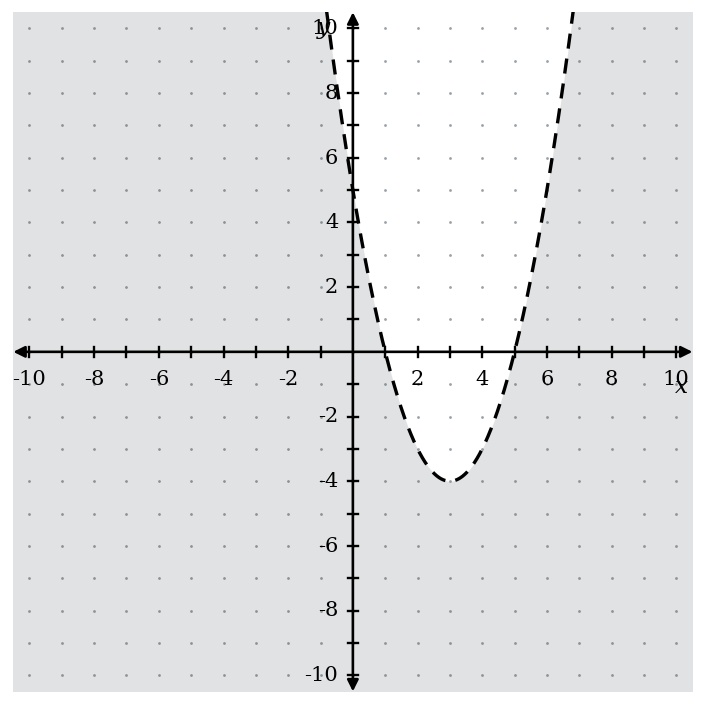
Write the inequality shown.
-
Write the inequality shown.
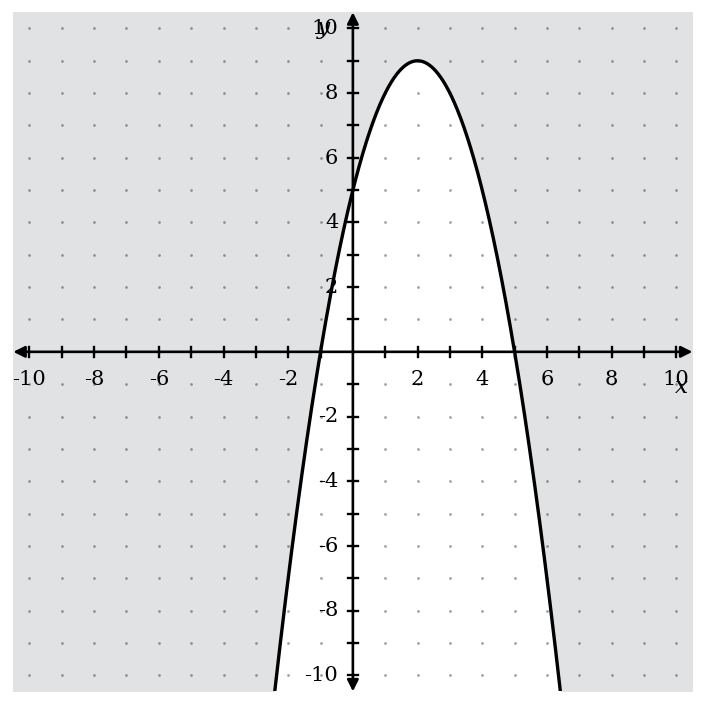
- Is (1, −2) a solution of y < x² − 3? Show the check.
- Is (0, 0) a solution of y ≥ (x − 1)² − 3? Show the check.
- A graph shows the parabola y = x² − 4 drawn solid, with the origin inside the shaded region. Write the inequality.
- A sprinkler sprays an arc shaped like y = −0.5(x − 4)² + 8, and everything at or below the arc gets watered. Write the inequality, then decide whether a plant at (2, 4) gets wet.
- Which of y > x² and y ≥ x² has (2, 4) as a solution? Explain in one line.
Graphing Quadratic Inequalities Worksheet: Answer Key
Part A answers — graphing the inequality
1. y > x² − 4
Vertex (0, −4), crosses at ±2. Strict >, so dashed. Test (0, 0): 0 > −4 is true.
Dashed · shade the region containing the origin — inside the parabola
2. y ≤ x² + 2x − 3
Factors to (x + 3)(x − 1), so it crosses at −3 and 1 with vertex (−1, −4). The line under the sign means solid. Test (0, 0): 0 ≤ −3 is false.
Solid · shade below the curve, away from the origin
3. y < −x² + 4
Opens down from (0, 4), crossing at ±2. Dashed. Test (0, 0): 0 < 4 is true.
Dashed · shade everything below the curve, including the origin
4. y ≥ (x − 2)² − 1
Vertex (2, −1), crossing at 1 and 3. Solid. Test (0, 0): 0 ≥ 3 is false, so the origin is out.
Solid · shade above the curve — the inside of the parabola
5. y < x² − 6x + 5
(x − 1)(x − 5), so roots at 1 and 5, vertex (3, −4). Dashed. Test (0, 0): 0 < 5 is true.
Dashed · shade below the curve, including the origin
6. y ≥ −(x + 1)² + 4
Opens down from (−1, 4), crossing at −3 and 1. Solid. Test (0, 0): 0 ≥ 3 is false.
Solid · shade above the curve, away from the origin
7. y > x² − 2x — the one with the trap
Careful — the origin is on this curve, so it can't be the test point. Vertex (1, −1), roots 0 and 2. Try (1, 0) instead: 0 > −1 is true.
Dashed · shade inside the parabola, the side containing (1, 0)
8. y ≤ −x² − 4x − 3
Factor out −1: −(x + 1)(x + 3), so roots −3 and −1 and vertex (−2, 1). Solid. Test (0, 0): 0 ≤ −3 is false.
Solid · shade below the curve, away from the origin
9. y < (x + 3)² − 2
Vertex (−3, −2), and the roots are irrational (−3 ± √2), so plot the vertex plus a point on each side instead. Dashed. Test (0, 0): 0 < 7 is true.
Dashed · shade below the curve, including the origin
10. y ≥ 2x² − 8x + 6
2(x − 1)(x − 3): roots 1 and 3, vertex (2, −2). The 2 out front makes it narrow. Solid. Test (0, 0): 0 ≥ 6 is false.
Solid · shade above the curve — inside the narrow parabola
Part B answers — reading the graph
11. Dashed curve, vertex (0, −4), shaded above
Vertex (0, −4), roots ±2, so a = 1 and the boundary is y = x² − 4. Dashed curve, shading above.
y > x² − 4
12. Solid downward curve, vertex (1, 4), shaded below
Opens down from (1, 4) through (3, 0), so 0 = 4a + 4 and a = −1. Solid curve, shading below.
y ≤ −(x − 1)² + 4, or y ≤ −x² + 2x + 3
13. Solid curve, vertex (−3, −4), shaded below
Vertex (−3, −4), roots −5 and −1, so a = 1. Solid curve, shading below.
y ≤ (x + 3)² − 4, or y ≤ x² + 6x + 5
14. Dashed curve, vertex (3, −4), shaded below
Vertex (3, −4), roots 1 and 5, so the boundary is y = x² − 6x + 5. Dashed, shading below.
y < x² − 6x + 5
15. Solid downward curve, vertex (2, 9), shaded above
Opens down from (2, 9) through (5, 0): 0 = 9a + 9, so a = −1. Solid, shading above — the region sitting on top of the arch, not the space underneath it.
y ≥ −(x − 2)² + 9, or y ≥ −x² + 4x + 5
16. Is (1, −2) a solution of y < x² − 3?
At x = 1 the boundary sits at 1 − 3 = −2, and −2 < −2 is false. The point is on the curve, and a strict inequality draws that curve dashed.
No — it sits exactly on the boundary
17. Is (0, 0) a solution of y ≥ (x − 1)² − 3?
(0 − 1)² − 3 = −2, and 0 ≥ −2 is true.
Yes
18. Solid y = x² − 4, origin shaded
Solid means ≤ or ≥. Test the origin against each: 0 ≥ −4 is true, 0 ≤ −4 is not.
y ≥ x² − 4
19. Sprinkler arc — the word problem
At or below means ≤ with a solid boundary. For the plant: −0.5(2 − 4)² + 8 = −2 + 8 = 6, and 4 ≤ 6.
y ≤ −0.5(x − 4)² + 8 · the plant gets wet
20. y > x² against y ≥ x², at (2, 4)
x² = 4 at x = 2, so the point is on the parabola. 4 > 4 is false; 4 ≥ 4 is true.
Only y ≥ x² — the solid boundary is the one that includes its own curve
Every answer above was checked for accuracy before publishing, most recently on . If you spot an error, email burketutoringinfremont@outlook.com or text (510) 453-0350 and it will be corrected.
Printing this for a class or a study group?
The PDF has the same 20 problems and the same answer key, laid out for letter paper.
Download the PDF worksheetFree to print and copy for classroom and home use. If it's useful, link to this page rather than re-hosting the PDF, so students always land on the corrected version.
Common Questions
How do you graph a quadratic inequality?
Replace the inequality sign with an equals sign and graph that parabola. Draw it dashed for < or >, solid for ≤ or ≥. Then pick a point off the curve, plug it in, and shade whichever side made the statement true.
When is the curve dashed instead of solid?
Whenever the sign is strict — < or >. Those points get infinitely close to the boundary without ever being allowed on it. With ≤ or ≥ the boundary is included, so draw it solid.
Which side of the parabola do I shade?
The side that contains a point that works. Test (0, 0) if the curve doesn't pass through it; otherwise grab any other easy point. Whichever side that point sits on is the side that gets shaded.
What if my test point lands on the parabola?
A point on the parabola does not tell you which side of the boundary to shade. Pick a point off the curve instead. Pick a different point — one unit up or down is plenty. Problem 7 above is built to catch exactly this.
Is this the same as solving x² − 4 > 0?
Related, but not the same thing. That version has one variable and the answer is an interval on the number line, like x < −2 or x > 2. This page is the two-variable version, where the answer is a shaded region in the plane.
What about a system of two quadratic inequalities?
Graph each one the same way, then keep only the overlap. Where the two shaded regions cross is the solution set, and a point has to satisfy both statements to be in it.
What grade level is this worksheet for?
Algebra I introduces it near the end of the quadratics unit, and Algebra II picks it up again, usually right before systems of inequalities. Part A works as a warm-up; Part B is closer to test level.
Keep Practicing
The boundary curve is half of every problem on this page, so the rest of the quadratics unit pays off directly: solving quadratics by factoring gets you the x-intercepts fast, the quadratic formula handles the ugly ones, and the discriminant tells you whether the parabola crosses the axis at all. For the shape itself, try completing the square, quadratic transformations, or the focus and directrix worksheet.
About the Author

Berke has taught K–12 math and science for more than 10 years, logging over 6,000 tutoring hours with 200+ students. He holds a BS in Biochemistry from Washington University in St. Louis and an MS in Bioinformatics from UMGC.
He writes every worksheet on this site from problems he actually uses in sessions, which is why problem 7 has a test point sitting on the curve — that one catches somebody every single year.
How these are made: problems are prepared from previous class notes and assigned homework, and every answer is checked for accuracy before publishing. Corrections come in by email or text and get fixed the same week.
More: tutor profile · LinkedIn · burketutoringinfremont@outlook.com
Page Updates
- — page published with 20 problems, four color-coded figures, five graphs to read, and the printable PDF.
- — added quadratics hub page link.
- — Improved wording and clarity.
If you want someone sitting next to you while you work through this graphing quadratic inequalities worksheet, Burke Tutoring offers in-home algebra tutoring in Fremont, Newark, and Union City. Call (510) 453-0350, or read what local families say first.
Burke Tutoring · Fremont, CA 94538 · (510) 453-0350 · Serving Fremont · Newark · Union City