Graphing Quadratic Functions: Vertex, X-Intercepts, and Y-Intercept
A free printable worksheet and guide — find the vertex, x-intercepts, and y-intercept for 20 parabolas, then sketch the curve through them
The short version: to graph y = ax² + bx + c, find three things before you draw anything. The y-intercept is (0, c). The x-intercepts come from setting y = 0 and factoring or using the quadratic formula. The vertex sits at x = −b⁄2a, and you substitute that value back in to get its y-coordinate. Plot those points, check the sign of a to see which way the curve opens, and sketch. The 20 practice problems and full answer key below are free to print.
Want the printable version?
Worked examples, 20 practice problems, and a complete answer key. No sign-up, no email required.
This worksheet starts from a different place than most students do. The usual approach is a table of values — plugging in x = −3, −2, −1, 0, 1, 2, 3 and plotting whatever comes out. It works, eventually, but it is slow and it often misses the part of the curve that actually matters. If the vertex happens to sit at x = 7, a table running from −3 to 3 will show you a curve that looks almost like a straight line.
There is a faster way. Every parabola is pinned down by three things: where it crosses the x-axis, where it crosses the y-axis, and where it turns around. Find those first, plot them, and the curve almost draws itself.
Y-intercept: set x = 0. For y = ax² + bx + c this is simply the point (0, c) — no work required.
X-intercepts: set y = 0 and solve the quadratic. There may be two, one, or zero real roots.
vertex: x = −b ⁄ 2a
then substitute that x back in to get the y-coordinate
Why These Three Points Are Enough
A parabola is not a free-form curve. Once you know it is a quadratic, its shape is already determined up to stretching and shifting, so a small number of anchor points locks it in completely. The vertex tells you where the curve turns and, because every parabola is symmetric about its vertex, it also tells you that whatever happens on one side happens in mirror image on the other.
The x-intercepts need some work done, and they come from factoring the quadratic or applying the quadratic formula. If you would like a second explanation of the underlying shape, Khan Academy covers graphing quadratic functions from the transformations angle.
How to Graph a Quadratic Function: The Steps
- Check the sign of a to see which way it opens. If a is positive the parabola opens upward and the vertex is the lowest point. If a is negative it opens downward and the vertex is the highest point. Doing this first means you will notice immediately if your sketch comes out upside down.
- Write down the y-intercept. It is (0, c). This takes two seconds and gives you a guaranteed point on the curve.
- Set y = 0 and solve for the x-intercepts. Factor if it factors, otherwise use the quadratic formula. If the discriminant comes out negative, there are no x-intercepts and the parabola will either be above or below the axis.
- Find the vertex with x = −b ⁄ 2a, then substitute back for y. The x-value alone is not the vertex; you need the matching y-coordinate to have an actual point to plot.
- Plot everything, then sketch the curve through the points. Draw the axis of symmetry through the vertex as a light dashed line first — this keeps both halves even and makes a lopsided sketch obvious right away.
If you already have both x-intercepts, you do not need the vertex formula at all. The vertex sits exactly halfway between them, so average the two roots. For a parabola crossing at x = −1 and x = 5, the vertex is at x = 2, and you only need one substitution to finish. This is covered in more depth on the vertex and axis of symmetry worksheet, and the OpenStax Algebra and Trigonometry chapter sets out the same relationships if you want a textbook treatment.
Worked Examples
Three problems are worked in full below, one for each case you will run into: two intercepts, a repeated intercept, and none at all.
Example 1 — two x-intercepts
y = x² − 2x − 3
Here a = 1, so the parabola opens upward. The y-intercept is the constant term, giving the point (0, −3). Setting y = 0 and factoring gives (x + 1)(x − 3) = 0, so the curve crosses the x-axis at x = −1 and x = 3. For the vertex, x = −(−2) ⁄ 2(1) = 1, and substituting back gives y = 1 − 2 − 3 = −4.
Vertex (1, −4) · X-intercepts (−1, 0) and (3, 0) · Y-intercept (0, −3). Notice that the vertex x-value of 1 is exactly halfway between the roots −1 and 3, which is a useful check that nothing went wrong.
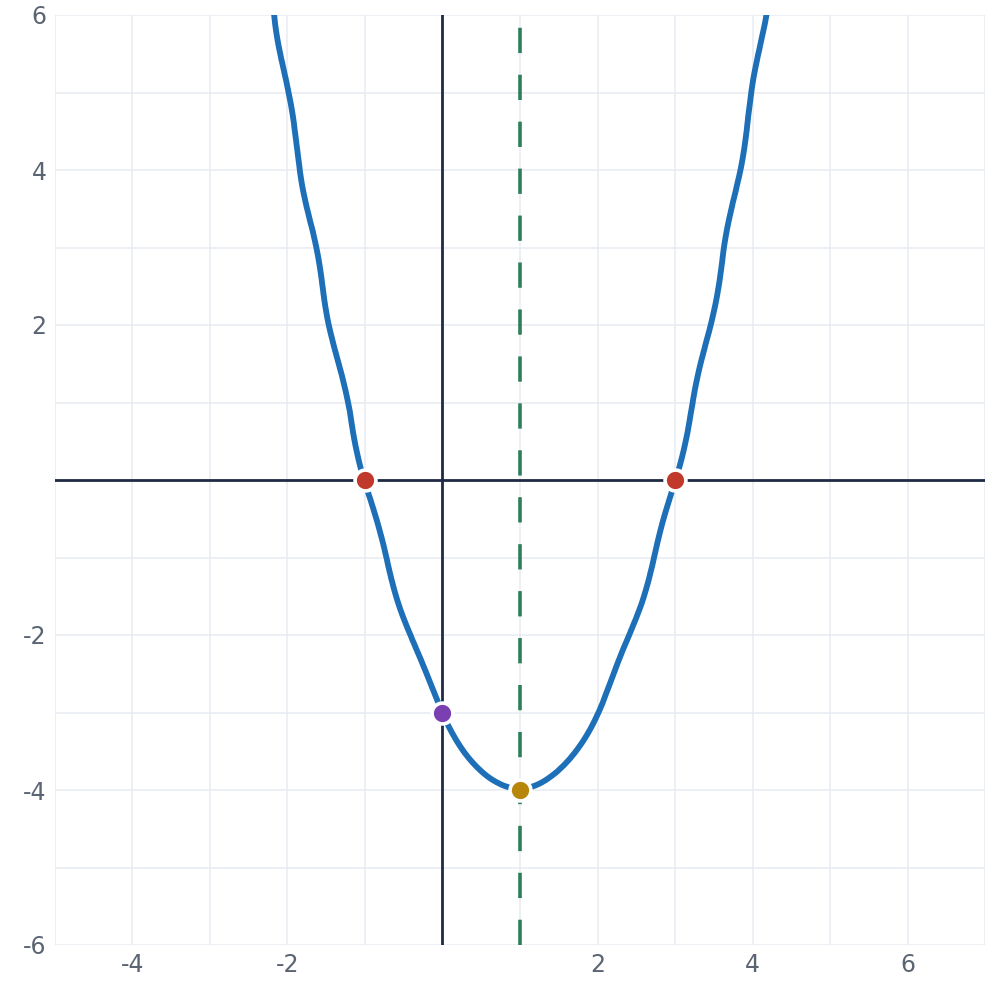
| Color | What it marks |
|---|---|
| Blue curve | y = x² − 2x − 3 |
| Gold | vertex (1, −4) |
| Red | x-intercepts (−1, 0) and (3, 0) |
| Purple | y-intercept (0, −3) |
| Green dashed | axis of symmetry x = 1 |
Example 2 — the y-intercept sits on a root
y = −x² + 4x
This one opens downward because a is negative, so the vertex will be the maximum. There is no constant term, which means c = 0 and the y-intercept is the origin. Factoring gives x(−x + 4) = 0, so the roots are x = 0 and x = 4 — meaning the y-intercept and one of the x-intercepts are the same point. The vertex sits at x = −4 ⁄ 2(−1) = 2, and substituting gives y = −4 + 8 = 4.
Vertex (2, 4) · X-intercepts (0, 0) and (4, 0) · Y-intercept (0, 0). When a quadratic has no constant term, the origin is always on the curve. That is worth recognizing on sight rather than working out each time.
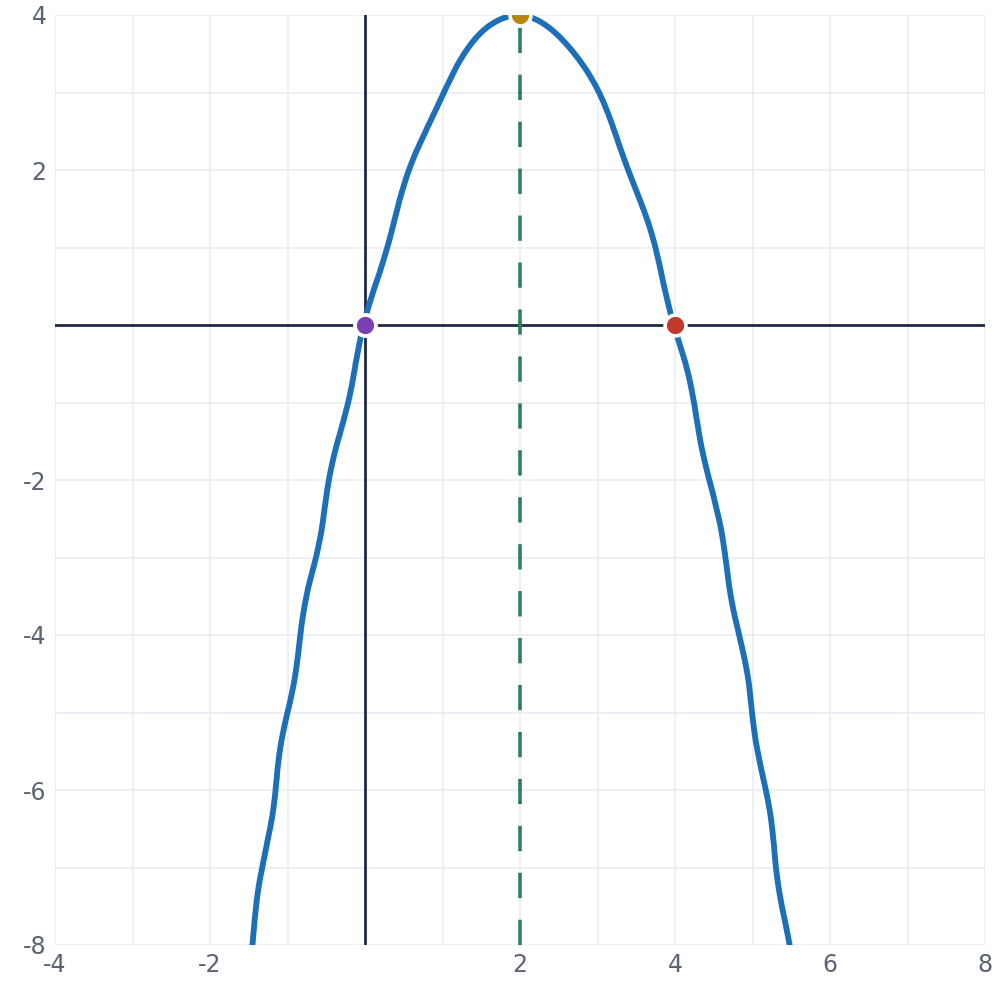
| Color | What it marks |
|---|---|
| Blue curve | y = −x² + 4x |
| Gold | vertex (2, 4), a maximum |
| Red | x-intercepts (0, 0) and (4, 0) |
| Purple | y-intercept (0, 0), same point as a root |
| Green dashed | axis of symmetry x = 2 |
Example 3 — no x-intercepts at all
y = x² − 4x + 7
The y-intercept is (0, 7). Trying to solve y = 0 gives a discriminant of b² − 4ac = 16 − 28 = −12, which is negative, so there are no real roots and the parabola never touches the x-axis. You still have the vertex. It sits at x = −(−4) ⁄ 2(1) = 2, with y = 4 − 8 + 7 = 3.
Vertex (2, 3) · No x-intercepts · Y-intercept (0, 7). Students often decide the problem is broken when the roots come out imaginary. The parabola sits entirely above the x-axis. Since a is positive and the vertex y-value of 3 is above zero, that is exactly what you should expect.
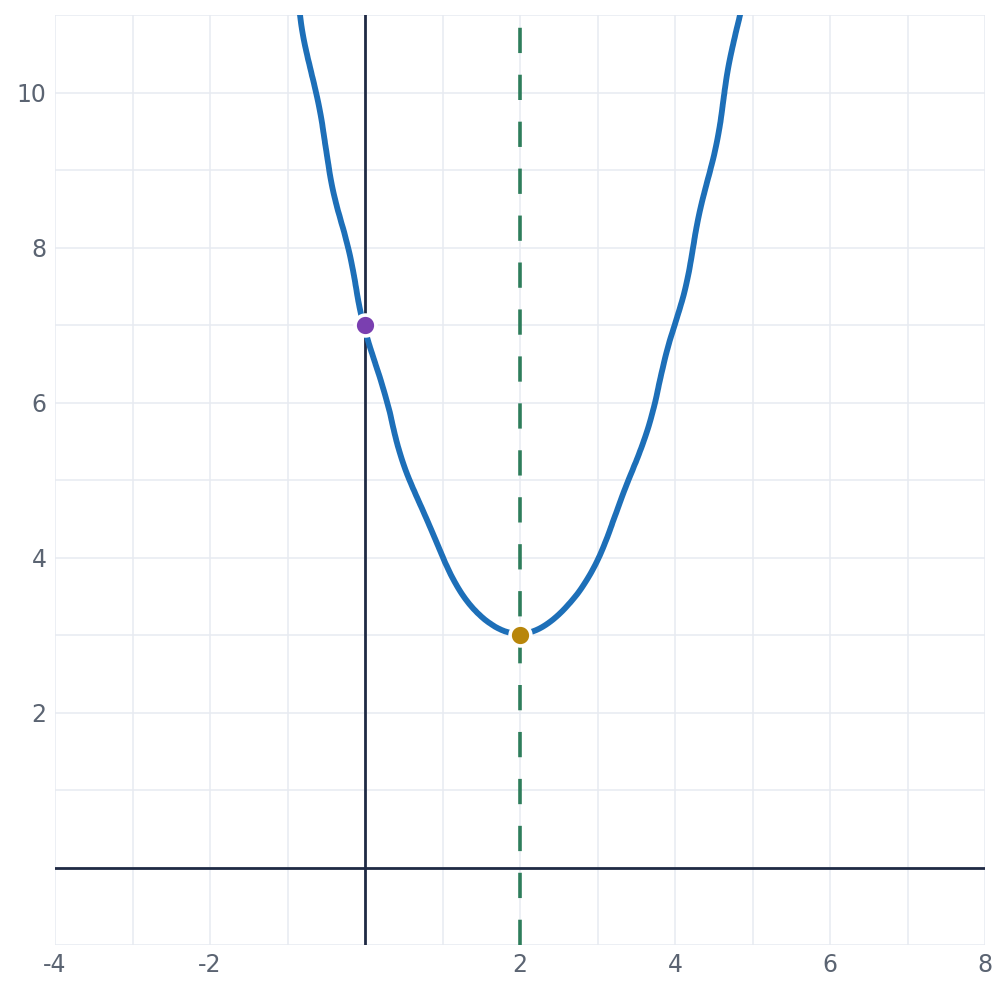
| Color | What it marks |
|---|---|
| Blue curve | y = x² − 4x + 7 |
| Gold | vertex (2, 3) |
| Purple | y-intercept (0, 7) |
| Green dashed | axis of symmetry x = 2 |
| No red points | no x-intercepts — discriminant is −12 |
Practice Problems
These are ordered so the straightforward ones come first. For each quadratic below, find the y-intercept, the x-intercepts, and the vertex, then sketch the parabola. A few have no real x-intercepts, and one has a repeated root where the vertex sits directly on the axis — those are there on purpose, because they are the two cases students most often assume they have got wrong.
- y = x² − 4x + 3Y-int: ________ X-int: ________
Vertex: ________ - y = x² + 2x − 8Y-int: ________ X-int: ________
Vertex: ________ - y = x² − 6x + 5Y-int: ________ X-int: ________
Vertex: ________ - y = x² + 4x + 3Y-int: ________ X-int: ________
Vertex: ________ - y = −x² + 2x + 3Y-int: ________ X-int: ________
Vertex: ________ - y = x² − 2x − 15Y-int: ________ X-int: ________
Vertex: ________ - y = 2x² − 8x + 6Y-int: ________ X-int: ________
Vertex: ________ - y = x² + 6x + 8Y-int: ________ X-int: ________
Vertex: ________ - y = x² − 9Y-int: ________ X-int: ________
Vertex: ________ - y = x² − 8x + 16Y-int: ________ X-int: ________
Vertex: ________ - y = −x² + 6x − 8Y-int: ________ X-int: ________
Vertex: ________ - y = x² + 3x − 4Y-int: ________ X-int: ________
Vertex: ________ - y = x² − 4x + 7Y-int: ________ X-int: ________
Vertex: ________ - y = 2x² + 4x − 6Y-int: ________ X-int: ________
Vertex: ________ - y = x² − 5x + 6Y-int: ________ X-int: ________
Vertex: ________ - y = −2x² + 4x + 6Y-int: ________ X-int: ________
Vertex: ________ - y = x² + 8x + 15Y-int: ________ X-int: ________
Vertex: ________ - y = x² − x − 12Y-int: ________ X-int: ________
Vertex: ________ - y = 3x² − 6x − 9Y-int: ________ X-int: ________
Vertex: ________ - y = x² + 2x + 5Y-int: ________ X-int: ________
Vertex: ________
Answer Key
Every problem is worked out below, not just answered. Click a question to reveal the full solution.
1. y = x² − 4x + 3
Y-intercept: (0, 3). Factors to (x − 1)(x − 3), so roots are 1 and 3.
Vertex: x = 4 ⁄ 2 = 2, y = 4 − 8 + 3 = −1Y-int (0, 3) · X-int (1, 0) and (3, 0) · Vertex (2, −1) · opens upward
2. y = x² + 2x − 8
Y-intercept: (0, −8). Factors to (x + 4)(x − 2), so roots are −4 and 2.
Vertex: x = −2 ⁄ 2 = −1, y = 1 − 2 − 8 = −9Y-int (0, −8) · X-int (−4, 0) and (2, 0) · Vertex (−1, −9) · opens upward
3. y = x² − 6x + 5
Y-intercept: (0, 5). Factors to (x − 1)(x − 5), so roots are 1 and 5.
Vertex: x = 6 ⁄ 2 = 3, y = 9 − 18 + 5 = −4Y-int (0, 5) · X-int (1, 0) and (5, 0) · Vertex (3, −4) · opens upward
4. y = x² + 4x + 3
Y-intercept: (0, 3). Factors to (x + 1)(x + 3), so roots are −1 and −3.
Vertex: x = −4 ⁄ 2 = −2, y = 4 − 8 + 3 = −1Y-int (0, 3) · X-int (−3, 0) and (−1, 0) · Vertex (−2, −1) · opens upward
5. y = −x² + 2x + 3
Y-intercept: (0, 3). Factoring out −1 gives −(x − 3)(x + 1), so roots are 3 and −1.
Vertex: x = −2 ⁄ −2 = 1, y = −1 + 2 + 3 = 4Y-int (0, 3) · X-int (−1, 0) and (3, 0) · Vertex (1, 4) · opens downward, so this is a maximum
6. y = x² − 2x − 15
Y-intercept: (0, −15). Factors to (x − 5)(x + 3), so roots are 5 and −3.
Vertex: x = 2 ⁄ 2 = 1, y = 1 − 2 − 15 = −16Y-int (0, −15) · X-int (−3, 0) and (5, 0) · Vertex (1, −16) · opens upward
7. y = 2x² − 8x + 6
Y-intercept: (0, 6). Factor out 2 first: 2(x² − 4x + 3) = 2(x − 1)(x − 3), so roots are 1 and 3.
Vertex: x = 8 ⁄ 4 = 2, y = 8 − 16 + 6 = −2Y-int (0, 6) · X-int (1, 0) and (3, 0) · Vertex (2, −2) · opens upward, narrower than usual since a = 2
8. y = x² + 6x + 8
Y-intercept: (0, 8). Factors to (x + 2)(x + 4), so roots are −2 and −4.
Vertex: x = −6 ⁄ 2 = −3, y = 9 − 18 + 8 = −1Y-int (0, 8) · X-int (−4, 0) and (−2, 0) · Vertex (−3, −1) · opens upward
9. y = x² − 9
Y-intercept: (0, −9). This is a difference of squares: (x − 3)(x + 3), so roots are 3 and −3.
Vertex: b = 0, so x = 0, y = −9. The vertex sits on the y-axis.Y-int (0, −9) · X-int (−3, 0) and (3, 0) · Vertex (0, −9) · vertex and y-intercept are the same point
10. y = x² − 8x + 16
Y-intercept: (0, 16). This is a perfect square, (x − 4)², so there is one repeated root at x = 4.
Vertex: x = 8 ⁄ 2 = 4, y = 16 − 32 + 16 = 0Y-int (0, 16) · X-int (4, 0) only · Vertex (4, 0) · the vertex sits on the x-axis, so the curve touches without crossing
11. y = −x² + 6x − 8
Y-intercept: (0, −8). Factoring out −1 gives −(x − 4)(x − 2), so roots are 4 and 2.
Vertex: x = −6 ⁄ −2 = 3, y = −9 + 18 − 8 = 1Y-int (0, −8) · X-int (2, 0) and (4, 0) · Vertex (3, 1) · opens downward, so this is a maximum
12. y = x² + 3x − 4
Y-intercept: (0, −4). Factors to (x + 4)(x − 1), so roots are −4 and 1.
Vertex: x = −3 ⁄ 2, y = 9/4 − 9/2 − 4 = −25/4Y-int (0, −4) · X-int (−4, 0) and (1, 0) · Vertex (−3/2, −25/4) · opens upward
13. y = x² − 4x + 7
Y-intercept: (0, 7). Discriminant is 16 − 28 = −12, which is negative, so there are no real x-intercepts.
Vertex: x = 4 ⁄ 2 = 2, y = 4 − 8 + 7 = 3Y-int (0, 7) · no x-intercepts · Vertex (2, 3) · opens upward and floats entirely above the x-axis
14. y = 2x² + 4x − 6
Y-intercept: (0, −6). Factor out 2: 2(x² + 2x − 3) = 2(x + 3)(x − 1), so roots are −3 and 1.
Vertex: x = −4 ⁄ 4 = −1, y = 2 − 4 − 6 = −8Y-int (0, −6) · X-int (−3, 0) and (1, 0) · Vertex (−1, −8) · opens upward
15. y = x² − 5x + 6
Y-intercept: (0, 6). Factors to (x − 2)(x − 3), so roots are 2 and 3.
Vertex: x = 5 ⁄ 2, y = 25/4 − 25/2 + 6 = −1/4Y-int (0, 6) · X-int (2, 0) and (3, 0) · Vertex (5/2, −1/4) · opens upward
16. y = −2x² + 4x + 6
Y-intercept: (0, 6). Factor out −2: −2(x² − 2x − 3) = −2(x − 3)(x + 1), so roots are 3 and −1.
Vertex: x = −4 ⁄ −4 = 1, y = −2 + 4 + 6 = 8Y-int (0, 6) · X-int (−1, 0) and (3, 0) · Vertex (1, 8) · opens downward, so this is a maximum
17. y = x² + 8x + 15
Y-intercept: (0, 15). Factors to (x + 3)(x + 5), so roots are −3 and −5.
Vertex: x = −8 ⁄ 2 = −4, y = 16 − 32 + 15 = −1Y-int (0, 15) · X-int (−5, 0) and (−3, 0) · Vertex (−4, −1) · opens upward
18. y = x² − x − 12
Y-intercept: (0, −12). Factors to (x − 4)(x + 3), so roots are 4 and −3.
Vertex: x = 1 ⁄ 2, y = 1/4 − 1/2 − 12 = −49/4Y-int (0, −12) · X-int (−3, 0) and (4, 0) · Vertex (1/2, −49/4) · opens upward
19. y = 3x² − 6x − 9
Y-intercept: (0, −9). Factor out 3: 3(x² − 2x − 3) = 3(x − 3)(x + 1), so roots are 3 and −1.
Vertex: x = 6 ⁄ 6 = 1, y = 3 − 6 − 9 = −12Y-int (0, −9) · X-int (−1, 0) and (3, 0) · Vertex (1, −12) · opens upward and is narrower since a = 3
20. y = x² + 2x + 5
Y-intercept: (0, 5). Discriminant is 4 − 20 = −16, which is negative, so there are no real x-intercepts.
Vertex: x = −2 ⁄ 2 = −1, y = 1 − 2 + 5 = 4Y-int (0, 5) · no x-intercepts · Vertex (−1, 4) · opens upward and sits entirely above the x-axis
Common Questions
What are the three things you need to graph a parabola?
The y-intercept, the x-intercepts, and the vertex. The y-intercept is the constant term, the x-intercepts come from setting y = 0, and the vertex comes from x = −b ⁄ 2a. Those three anchor points, plus the sign of a, fix the curve.
How do you find the vertex of a quadratic function?
Use x = −b ⁄ 2a, then substitute that x value back into the original equation to get y. If you already know both x-intercepts, averaging them gives the same x value with less arithmetic.
What if the quadratic has no x-intercepts?
The discriminant b² − 4ac is negative, so the parabola never touches the x-axis. You can still graph it — the vertex and the y-intercept are enough, and the sign of a tells you whether the whole curve sits above or below the axis.
Do you need a table of values to graph a quadratic?
No. A table works but wastes time and can miss the vertex entirely if it happens to fall outside the range you chose. Once the three anchor points are plotted, one or two extra points are usually all you need to get the width of the curve right.
What grade level is this worksheet for?
Algebra I, typically 8th or 9th grade, and it is also standard review in Algebra II. It aligns with CCSS.MATH.CONTENT.HSF.IF.C.7a.
The 20 problems here are drawn from the ones I actually assign in sessions. The ordering is deliberate: the first eight factor cleanly so students build the routine, then the fractional vertices, repeated root, and negative discriminants come later, because those are the three places where students most often conclude they have made a mistake when they have not.
Every answer was worked by hand and checked against a graph before publishing. If you spot an error, tell me and I will fix it and note the correction date.
↓ Download the printable worksheet
Guide + worked examples + answer key · Free to print for classroom and home use
If quadratics are a recurring problem rather than a one-worksheet problem, Burke Tutoring offers in-home algebra tutoring in Fremont, Newark, and Union City.