AP Physics 1 · Unit 1 · Kinematics worksheets
AP Physics 1 Kinematics FRQ Practice: 8 Free-Response Questions
Two exam-style sets with scoring guides and a printable PDF
These eight free-response questions cover Unit 1 of AP Physics 1: motion graphs, constant acceleration, free fall, relative motion in one dimension, and projectile motion. Each question is written in one of the four formats used on the exam’s free-response section, and Questions 1 to 4 and Questions 5 to 8 each make a complete practice set. A point-by-point scoring guide sits under every question. For the concepts behind them, use the AP Physics 1 kinematics study guide and the free fall problems guide.

Written by Berke Sahbazoglu · Owner and tutor, Burke Tutoring In Fremont · BA Biochemistry, Washington University in St. Louis · 10+ years tutoring math and science, including AP Physics 1 · Full bio
Published October 18, 2026 · Last updated October 18, 2026 · Free to print and use in class
| Course | AP Physics 1, Unit 1 (kinematics) |
|---|---|
| Questions | 8 free-response questions in two sets of four |
| Question types | Mathematical routines, translation between representations, experimental design and analysis, and qualitative/quantitative translation, once in each set |
| Scoring | Point-by-point guide under each question, 40 points per set |
| Time | 95 minutes per set, the length of the free-response section on the current exam |
| Printable | PDF in the exam booklet layout, with scoring guidelines |
| Assumptions | g = 9.8 m/s2, air resistance negligible |
Printable PDF
All 8 questions laid out like the exam booklet, with blank graph grids and the scoring guidelines at the back. 35 pages, US Letter.
Download the PDF01 / Before you start
How the AP Physics 1 free-response section works
The free-response section of the AP Physics 1 exam has four questions, one of each type in the table below. The point values match College Board’s 2026 scoring guidelines, and the current exam allows 95 minutes for all four questions.
| Question type | On this page | Points | What the question asks you to do |
|---|---|---|---|
| Mathematical routines | Questions 1 and 5 | 10 | Sketch graphs, derive symbolic expressions from a starting equation, then compare two situations and justify the comparison in words. |
| Translation between representations | Questions 2 and 6 | 12 | Move between a diagram, an equation, and a graph of the same motion, and check that they agree. |
| Experimental design and analysis | Questions 3 and 7 | 10 | Plan a measurement with limited equipment, choose axes that give a straight line, plot data, and use the best-fit line. |
| Qualitative/quantitative translation | Questions 4 and 8 | 8 | Reason in words first, derive an expression, then show whether the two agree. |
Every part starts with a bold task verb, and the verb tells you what earns credit.
- Derive: start from a fundamental principle or an equation on the reference sheet and show the algebra that leads to the final expression.
- Justify: give the physics reason in words. Restating an equation is not enough.
- Indicate: write one of the listed choices.
- Sketch: show the correct shape and trend. Exact values are needed only where the axes have a scale.
- Draw, plot, and label: mark arrows, data points, best-fit lines, and axis labels on the figure.
- Calculate: give a number with units.
How the scoring guides work. Each scoring guide lists every point with what earns it, and the example responses show one correct way to earn them. Equivalent physics reasoning and derivations earn the same points. When a criterion names one method, the matching step in another correct method earns that point, such as conservation of energy in Question 5 or relative motion in Questions 4 and 6. In the experimental design questions, any quantity that makes the graph linear earns credit when the slope is then related to the unknown correctly for that quantity.
How to use the two sets. Work each set in one sitting with the AP Physics 1 reference information open, and write your answers on paper before you open a scoring guide. After these two sets, College Board’s AP Physics 1 exam questions page has the released 2026 free-response questions and their scoring guidelines.
To review a skill before writing a full free-response solution, explore our kinematics worksheets and study guides. Choose a topic for worked examples and printable practice with answer keys, then return to these questions to practice explaining your reasoning.
02 / Practice set A
Set A: Questions 1 to 4
Set A starts with a ball kicked toward a wall and a cart’s velocity graph, then asks you to design an experiment for a cart rolling down a ramp, and ends with two stones falling from a bridge. Allow 95 minutes.
Question 1Mathematical RoutinesA kick toward a wall
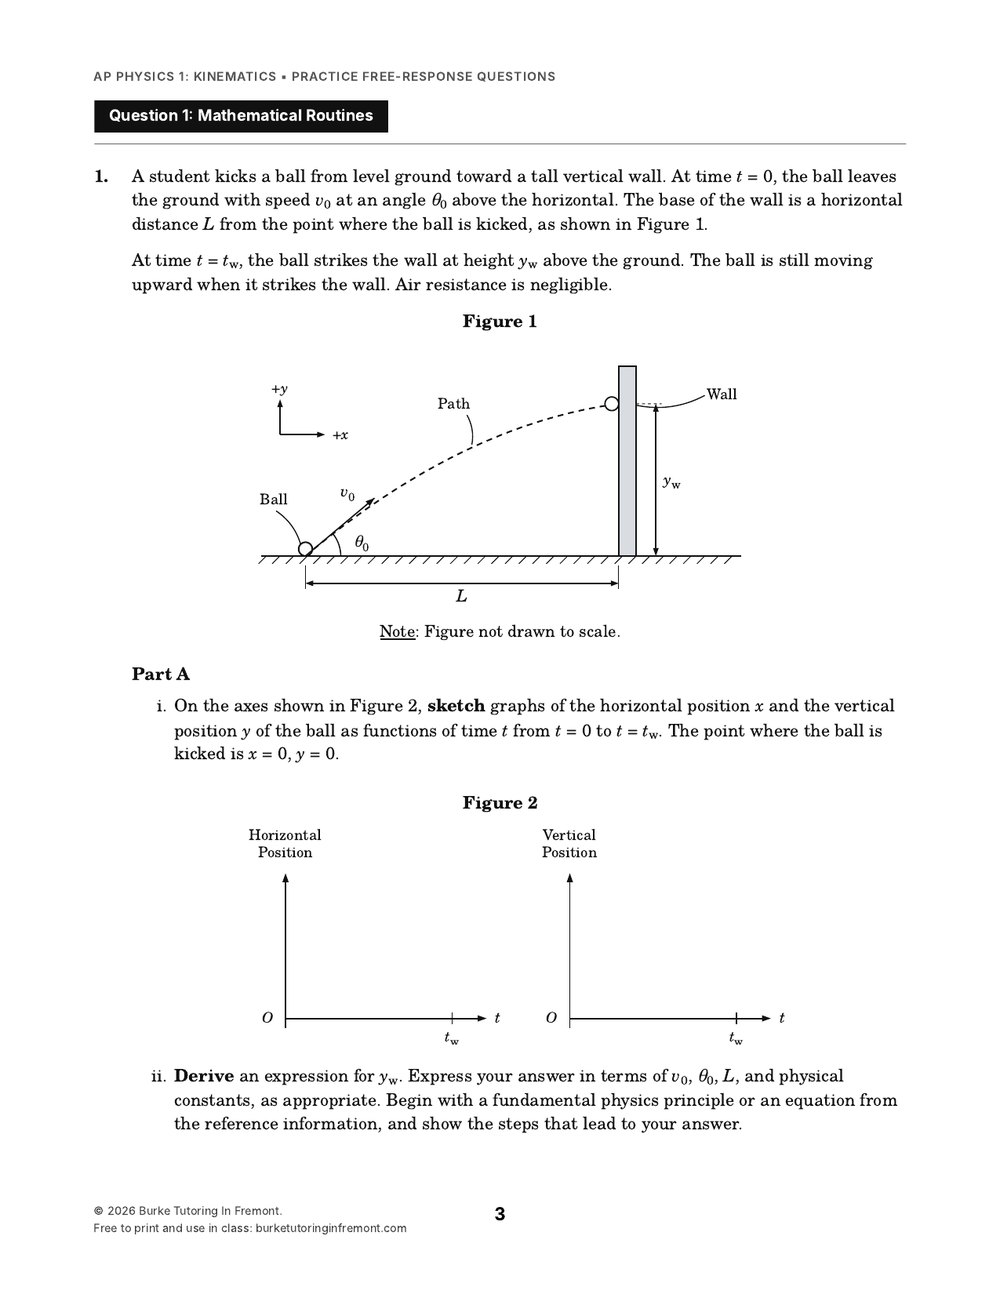
1.A student kicks a ball from level ground toward a tall vertical wall. At time t = 0, the ball leaves the ground with speed v0 at an angle θ0 above the horizontal. The base of the wall is a horizontal distance L from the point where the ball is kicked, as shown in Figure 1.
At time t = tw, the ball strikes the wall at height yw above the ground. The ball is still moving upward when it strikes the wall. Air resistance is negligible.
Figure 1
Note: Figure not drawn to scale.
Part A
On the axes shown in Figure 2, sketch graphs of the horizontal position x and the vertical position y of the ball as functions of time t from t = 0 to t = tw. The point where the ball is kicked is x = 0, y = 0.
Figure 2
Derive an expression for yw. Express your answer in terms of v0, θ0, L, and physical constants, as appropriate. Begin with a fundamental physics principle or an equation from the reference information, and show the steps that lead to your answer.
Derive an expression for the vertical component of the ball’s velocity at the instant the ball strikes the wall. Express your answer in terms of v0, θ0, L, and physical constants, as appropriate. Begin with a fundamental physics principle or an equation from the reference information.
Part B
The student kicks a second, identical ball from the same spot and at the same angle θ0, but with a speed greater than v0. The second ball also strikes the wall while it is still moving upward, at a height y2 above the ground.
Indicate whether y2 is greater than, less than, or equal to yw by writing one of the following.
- y2 > yw
- y2 < yw
- y2 = yw
Justify your answer. Your justification must include reasoning in words, not only equations or derivations.
Review: Splitting a launch into horizontal and vertical motion is covered in free fall and projectile motion in the AP Physics 1 kinematics study guide. Its projectile simulator lets you hold the angle fixed and raise the launch speed to see how the path changes.
Scoring guide for Question 1 (10 points)
Equivalent correct methods earn the same points. See how the scoring guides work.
| A1 | For a horizontal position graph that is a straight line with positive slope, starting at the origin. | 1 point |
|---|---|---|
| A2 | For a vertical position graph that starts at the origin and curves with a decreasing slope that is still positive at tw. | 1 point |
Example response
Scoring note: A vertical position graph that levels off or turns down before tw does not earn point A2, because the ball is still rising when it strikes the wall.
| A3 | For a multistep derivation that applies a kinematic equation to the horizontal motion and to the vertical motion, connected by the time tw. | 1 point |
|---|---|---|
| A4 | For using v0 cos θ0 as the horizontal component and v0 sin θ0 as the vertical component of the initial velocity. | 1 point |
| A5 | For a correct expression for yw. | 1 point |
Example response
Horizontal, with ax = 0: x = x0 + vx0t + one halfaxt2 → L = (v0 cos θ0)tw, so tw = L over v zero cos theta zero
Vertical, with ay = −g: yw = (v0 sin θ0)tw − one halfgtw2
yw = L tan θ0 − g L squared over 2 v zero squared cos squared theta zero
Scoring note: A correct final expression written with no supporting work earns point A5 but not point A3.
| A6 | For a correct method for the vertical velocity component at the wall, such as applying vy = vy0 + ayt with vy0 = v0 sin θ0 and ay = −g at t = tw. | 1 point |
|---|---|---|
| A7 | For a correct expression for the vertical velocity component at the wall. | 1 point |
Example response
vy = v0 sin θ0 − gtw = v0 sin θ0 − g L over v zero cos theta zero
Scoring note: This value is positive, which matches the statement that the ball is still rising at the wall.
Scoring note: An equivalent expression earns point A7, such as the positive root of vy2 = v02 sin2 θ0 − 2gyw with yw replaced by the result of Part A(ii).
| B1 | For indicating y2 > yw. | 1 point |
|---|---|---|
| B2 | For explaining that the faster ball has a larger horizontal velocity component, so it reaches the wall in less time. | 1 point |
| B3 | For explaining that a ball with less time in the air falls a shorter distance below the straight line of its launch direction, and both balls are launched along the same line, so the faster ball strikes the wall higher. | 1 point |
Example response
y2 > yw. Both balls leave along the same straight line at angle θ0. Without gravity, each would follow that line and hit the wall at height L tan θ0. Gravity pulls each ball below the line by an amount that grows with its time in the air. The faster ball has a larger horizontal velocity component, so it covers the horizontal distance L in less time. It falls a shorter distance below the line, so it strikes the wall higher. This agrees with Part A(ii): the term subtracted from L tan θ0 gets smaller as the launch speed increases.
Scoring note: Reasoning from the expression in Part A(ii) also earns points B2 and B3 if it explains in words that the term subtracted from L tan θ0 is inversely proportional to v02, so a faster kick subtracts less and the ball strikes the wall higher.
Question 2Translation Between RepresentationsReading a velocity graph
2.A cart moves along a straight, horizontal track. Figure 1 shows the velocity v of the cart as a function of time t from t = 0 to t = 4t0. The positive direction is to the right. At t = 0, the cart is at position x = 0.
Figure 1
Part A
The acceleration diagram in Figure 2 represents the acceleration of the cart at t = 0.5t0.
Figure 2
Draw arrows on Figure 3 to represent the acceleration of the cart at t = 1.5t0 and at t = 2.5t0.
- Start each arrow on the dot and point it away from the dot.
- If the acceleration at that instant is zero, write “a = 0” next to the dot.
- Make the length of each arrow represent the magnitude of the acceleration, using the same scale as Figure 2.
Figure 3
Part B
Derive an expression for the maximum position xmax that the cart reaches between t = 0 and t = 4t0. Express your answer in terms of v0, t0, and physical constants, as appropriate. Begin with a fundamental physics principle or an equation from the reference information.
Part C
On the axes in Figure 4, sketch a graph of the position x of the cart as a function of time t from t = 0 to t = 4t0.
Figure 4
Part D
Indicate whether the average speed of the cart from t = 0 to t = 4t0 is greater than, less than, or equal to the magnitude of the cart’s average velocity over the same interval by writing one of the following.
- Average speed > magnitude of average velocity
- Average speed < magnitude of average velocity
- Average speed = magnitude of average velocity
Briefly justify your answer.
Review: The slope and area rules for motion graphs in the kinematics study guide cover Parts B and C, and the same guide defines average speed and average velocity in its first section.
Scoring guide for Question 2 (12 points)
Equivalent correct methods earn the same points. See how the scoring guides work.
| A1 | For writing “a = 0” beside the dot for t = 1.5t0, with no arrow. | 1 point |
|---|---|---|
| A2 | For a single arrow pointing left from the dot for t = 2.5t0. | 1 point |
| A3 | For drawing the arrow at t = 2.5t0 four units long, twice the length of the arrow in Figure 2. | 1 point |
Example response
Scoring note: From 2t0 to 3t0 the velocity changes by −2v0 in a time t0, so the acceleration is −2v0/t0, twice the magnitude of the acceleration from 0 to t0. The velocity is zero at 2.5t0, but it is still changing, so the acceleration is not zero.
| B1 | For a multistep derivation that uses kinematic equations or areas under the velocity-time graph. | 1 point |
|---|---|---|
| B2 | For identifying that the cart is at its maximum position when its velocity becomes zero, at t = 2.5t0. | 1 point |
| B3 | For a correct displacement for a time interval in which the cart accelerates, such as one halfv0t0 from 0 to t0 or one fourthv0t0 from 2t0 to 2.5t0. | 1 point |
| B4 | For a correct expression for xmax. | 1 point |
Example response
From 0 to t0: a = v0/t0, so Δx1 = one halfat02 = one halfv0t0
From t0 to 2t0: Δx2 = v0t0
From 2t0 on: a = −2v0/t0. The velocity is zero when v0 − (2v0/t0)Δt = 0, so Δt = one halft0, at t = 2.5t0.
Δx3 = v0(one halft0) + one half(−2v0/t0)(one halft0)2 = one fourthv0t0
xmax = one halfv0t0 + v0t0 + one fourthv0t0 = seven fourthsv0t0
Scoring note: The areas under the velocity graph give the same result: a triangle, a rectangle, and a second triangle that ends where the line crosses the time axis.
| C1 | For a curve from the origin that bends upward (slope increasing) from 0 to t0, followed by a straight line with positive slope from t0 to 2t0. | 1 point |
|---|---|---|
| C2 | For a curve from 2t0 to 3t0 that bends downward and has its maximum at 2.5t0. | 1 point |
| C3 | For a straight line with negative slope from 3t0 to 4t0, with positions that match the grid: 0.5v0t0 at t0, 1.5v0t0 at 2t0 and at 3t0, and 0.5v0t0 at 4t0. | 1 point |
Example response
Key
Scoring note: The graph has no sharp corners, because its slope is the velocity, and the velocity never jumps from one value to another.
| D1 | For indicating that the average speed is greater than the magnitude of the average velocity. | 1 point |
|---|---|---|
| D2 | For explaining that the cart reverses direction at 2.5t0, so the distance it travels is greater than the magnitude of its displacement, and both are divided by the same time interval. | 1 point |
Example response
Average speed > magnitude of average velocity. Average speed is the distance traveled divided by the time, and average velocity is the displacement divided by the time. The cart moves right until 2.5t0 and then moves left. The leftward motion adds to the distance but cancels part of the displacement: the distance is 3v0t0, while the displacement is 0.5v0t0, over the same 4t0.
Question 3Experimental Design and AnalysisAcceleration down a ramp
The following information applies to Parts A and B.
3.A group of students wants to determine the magnitude a of the acceleration of a cart that rolls down a long, straight inclined track. The cart is released from rest at the top of the track, as shown in Figure 1. The angle of the track stays the same for the whole experiment, and the acceleration of the cart is constant.
Figure 1
Note: Figure not drawn to scale.
The students must design an experiment in which they vary one quantity and collect data that can be graphed to determine a. The only equipment available is a meterstick and a stopwatch.
Part A
Indicate the quantities the students should measure so that they can determine a from a linear graph.
Briefly describe one way the students could reduce the experimental uncertainty in these measurements.
Part B
Indicate the quantities the students could plot on the horizontal and vertical axes to produce a linear graph from which a can be determined. State clearly which quantity goes on each axis.
Briefly describe how a is related to a feature of the graph from Part B(i). You may include an equation that relates a to that feature.
The following information applies to Parts C and D.
In a different experiment, the students use two photogates connected to a timer, as shown in Figure 2. The cart is released from rest at the same point each time, so it passes Photogate 1 with the same speed u on every trial. The timer starts when the cart passes Photogate 1 and stops when the cart passes Photogate 2. The students move Photogate 2 to change the distance d between the photogates and record the time t the cart takes to travel from one photogate to the other. Table 1 shows the data.
Figure 2
Note: Figure not drawn to scale.
Table 1
| d (m) | t (s) |
|---|---|
| 0.40 | 0.84 |
| 0.80 | 1.40 |
| 1.20 | 1.80 |
| 1.60 | 2.19 |
| 2.00 | 2.49 |
The students correctly determine that d and t are related by d = ut + one halfat2, where u is the speed of the cart at Photogate 1. The students make a graph with t plotted on the horizontal axis.
Part C
Label the vertical axis of Figure 3 with a measured or calculated quantity, with units if it has any. Choose a quantity that makes the graph linear and lets you determine a.
On the grid in Figure 3, make a graph that can be used to determine a.
- Add a numerical scale to the vertical axis.
- Plot the data points.
- Work out the values you plot on scratch paper.
Figure 3
Draw a best-fit line through the data you plotted in Part C(ii).
Part D
Use your best-fit line from Part C(iii) to calculate an experimental value for a.
Review: The section on motion diagrams and measured data in the kinematics study guide shows why distance plotted against time squared is a straight line for an object that starts from rest.
Scoring guide for Question 3 (10 points)
Equivalent correct methods earn the same points. See how the scoring guides work.
| A(i) | For indicating that the students measure the distance d the cart rolls from rest and the time t it takes to roll that distance, for several different distances. | 1 point |
|---|---|---|
| A(ii) | For a valid way to reduce uncertainty, such as timing several trials at each distance and averaging the times, or using distances long enough that reaction time is a small part of each time. | 1 point |
| B(i) | For a pair of quantities that gives a linear graph, such as d on the vertical axis and t2 on the horizontal axis. | 1 point |
|---|---|---|
| B(ii) | For relating a feature of the graph to a, such as: for d versus t2, the slope equals one halfa, so a = 2 × slope. | 1 point |
Example response
Starting from rest, d = one halfat2. A graph of d (vertical axis) versus t2 (horizontal axis) is a straight line through the origin with slope one halfa, so a = 2 × slope.
Scoring note: Other linear choices earn credit with a matching relationship, such as t2 versus d (slope = 2/a) or 2d versus t2 (slope = a).
| C(i) | For labeling the vertical axis with a quantity that makes the graph linear with t on the horizontal axis, such as d/t or 2d/t, in m/s. | 1 point |
|---|---|---|
| C(ii) | For a linear numerical scale on the vertical axis. | 1 point |
| C(iii) | For plotting the five data points correctly for the chosen quantity. | 1 point |
| C(iv) | For a straight best-fit line that follows the trend of the data, with points on both sides of the line. | 1 point |
Example response
Key
Values plotted
| t (s) | d/t (m/s) |
|---|---|
| 0.84 | 0.476 |
| 1.40 | 0.571 |
| 1.80 | 0.667 |
| 2.19 | 0.731 |
| 2.49 | 0.803 |
| D(i) | For relating the slope to a correctly for the quantity plotted in Part C. For d/t versus t, the slope is one halfa, so a = 2 × slope. For 2d/t versus t, the slope is a. | 1 point |
|---|---|---|
| D(ii) | For a value of a between 0.36 m/s2 and 0.44 m/s2. | 1 point |
Example response
Dividing d = ut + one halfat2 by t gives d/t = u + one halfat, so the slope of the graph is one halfa.
Two points on the best-fit line: (0.50 s, 0.40 m/s) and (2.50 s, 0.80 m/s)
slope = (0.80 m/s − 0.40 m/s) ÷ (2.50 s − 0.50 s) = 0.20 m/s2
a = 2 × slope = 0.40 m/s2
Scoring note: A student who plotted 2d/t reads a slope of about 0.40 m/s2, which is a itself, and earns both points.
Scoring note: The vertical intercept, about 0.30 m/s on the d/t graph, is the speed u at Photogate 1. It is not needed to find a.
Question 4Qualitative/Quantitative TranslationTwo falling stones
4.Two small stones are released from rest from the same point beside a high bridge. Stone 1 is released at time t = 0. Stone 2 is released at time t = t0, as shown in Figure 1. Both stones are still falling at time t = 2t0. Air resistance is negligible.
Figure 1
Note: Figure not drawn to scale.
The distance between the stones is D1 at t = t0 and D2 at t = 2t0.
Part A
Indicate whether D2 is greater than, less than, or equal to D1 by writing one of the following.
- D2 > D1
- D2 < D1
- D2 = D1
Justify your answer in words, without relying on equations.
Part B
Starting with a kinematic equation, derive an expression for the distance D between the stones at any time t after Stone 2 is released, while both stones are still falling. Express your answer in terms of t, t0, and physical constants, as appropriate. Begin with a fundamental physics principle or an equation from the reference information.
Part C
Justify whether your expression from Part B is consistent with your reasoning in Part A.
Review: The free fall guide works through objects dropped from rest, including the distance fallen after a given time.
Scoring guide for Question 4 (8 points)
Equivalent correct methods earn the same points. See how the scoring guides work.
| A1 | For indicating D2 > D1. | 1 point |
|---|---|---|
| A2 | For explaining that both stones gain speed at the same rate, but Stone 1 has been falling longer, so at every instant after t0 it is moving faster than Stone 2. | 1 point |
| A3 | For connecting the difference in speeds to the separation: Stone 1 covers more distance than Stone 2 in every time interval, so the distance between them keeps growing. | 1 point |
Example response
D2 > D1. Both stones speed up at the same rate. Stone 1 started falling earlier, so at any instant after Stone 2 is released, Stone 1 has been falling longer and is moving faster. It falls farther than Stone 2 during each interval, so the gap between them grows.
| B1 | For a multistep derivation that applies a kinematic equation to each stone, or to the motion of Stone 1 relative to Stone 2. | 1 point |
|---|---|---|
| B2 | For accounting correctly for the later release of Stone 2, such as its fall distance one halfg(t − t0)2, or a separation of one halfgt02 at t = t0 that then grows at the relative speed gt0. | 1 point |
| B3 | For a correct expression for D. | 1 point |
Example response
Distance fallen from rest (down taken as positive): Δy = vy0t + one halfgt2 = one halfgt2
Stone 1: Δy1 = one halfgt2 Stone 2: Δy2 = one halfg(t − t0)2
D = Δy1 − Δy2 = one halfg[t2 − (t − t0)2] = gt0t − one halfgt02
Scoring note: Alternate solution (relative motion): when Stone 2 is released, Stone 1 has fallen one halfgt02 and is moving at gt0. After that both stones have the same acceleration, so Stone 1 moves away from Stone 2 at the constant relative speed gt0: D = one halfgt02 + gt0(t − t0) = gt0t − one halfgt02.
| C1 | For describing the functional dependence: D increases linearly with t, at a constant rate gt0. | 1 point |
|---|---|---|
| C2 | For applying it to Part A: since D grows as t grows, D at 2t0 (three halvesgt02) is greater than D at t0 (one halfgt02), which agrees with Part A. | 1 point |
Example response
Consistent. The expression D = gt0t − one halfgt02 increases linearly with time, so the stones get farther apart. The rate gt0 is the difference in the stones’ speeds, which stays the same because both speed up at the same rate. That is the reasoning in Part A.
03 / Practice set B
Set B: Questions 5 to 8
Set B covers a model rocket with two stages of motion, two travelers at an airport moving walkway, an experiment with a ball launcher, and stopping distance at two speeds. Allow 95 minutes.
Question 5Mathematical RoutinesA model rocket
5.A model rocket is launched straight up from rest on level ground at time t = 0, as shown in Figure 1. While its engine fires, the rocket has a constant upward acceleration of magnitude 2g. The engine stops firing at time t = T. After that, the rocket is in free fall until it returns to the ground at time t = tg. Air resistance is negligible.
Figure 1
Note: Figure not drawn to scale.
Part A
On the axes in Figure 2, sketch a graph of the vertical velocity vy of the rocket as a function of time t from t = 0 to t = tg. Take upward as positive.
Figure 2
Derive an expression for the maximum height H that the rocket reaches above the ground. Express your answer in terms of T and physical constants, as appropriate. Begin with a fundamental physics principle or an equation from the reference information, and show the steps that lead to your answer.
Derive an expression for the speed of the rocket just before it reaches the ground. Express your answer in terms of T and physical constants, as appropriate. Begin with a fundamental physics principle or an equation from the reference information.
Part B
A second rocket is launched from rest in the same way. Its engine gives it a constant upward acceleration of magnitude 4g and fires for a time one halfT. After its engine stops, the second rocket is also in free fall. The second rocket reaches a maximum height H2.
Indicate whether H2 is greater than, less than, or equal to H by writing one of the following.
- H2 > H
- H2 < H
- H2 = H
Justify your answer. Your justification must include reasoning in words, not only equations or derivations.
Review: Once the engine stops, the rocket moves like a ball thrown straight up, starting with the speed it had at engine cutoff. The free fall guide works through that case in objects thrown straight up.
Scoring guide for Question 5 (10 points)
Equivalent correct methods earn the same points. See how the scoring guides work.
| A1 | For a straight line with positive slope from the origin to t = T. | 1 point |
|---|---|---|
| A2 | For a straight line with negative slope from T to tg that crosses the time axis and is less steep than the first line. | 1 point |
Example response
Key
Scoring note: The line crosses zero at 3T and ends at −√6 gT, which is larger in magnitude than 2gT. These details are not required.
| A3 | For a multistep derivation that treats the powered stage and the free-fall stage separately. | 1 point |
|---|---|---|
| A4 | For a correct speed (2gT) or height (gT2) at the instant the engine stops. | 1 point |
| A5 | For a correct expression for H, using a vertical velocity of zero at the highest point. | 1 point |
Example response
Powered stage, ay = 2g: v1 = 0 + (2g)T = 2gT, y1 = one half(2g)T2 = gT2
Free fall, ay = −g, with vy = 0 at the top: 0 = v12 − 2g(H − y1)
H − y1 = 2 g T squared over 2 g = 2gT2
H = gT2 + 2gT2 = 3gT2
Scoring note: Alternate solution (energy): after the engine stops, only gravity does work on the rocket, so its mechanical energy is constant. With the ground as the zero of gravitational potential energy, one halfm(2gT)2 + mg(gT2) = mgH, which gives H = 3gT2. This earns points A3, A4, and A5.
| A6 | For applying a kinematic equation or conservation of energy to the fall, such as vy2 = vy02 + 2ayΔy from the highest point with vy0 = 0 and Δy = −H, or mgH = one halfmv2. | 1 point |
|---|---|---|
| A7 | For a correct expression for the speed just before the rocket reaches the ground. | 1 point |
Example response
From the highest point: v2 = 0 + 2gH = 2g(3gT2) = 6g2T2
v = √6 gT (about 2.4gT)
Scoring note: Other correct methods give the same result. From the moment the engine stops, v2 = (2gT)2 + 2g(gT2) = 6g2T2. With energy, mgH = one halfmv2 gives v = √(2gH) = √6 gT. The three-ball race on the free fall page shows why, in free fall, the rocket passes the cutoff height on the way down with the same speed, 2gT, that it had there on the way up.
| B1 | For indicating H2 < H. | 1 point |
|---|---|---|
| B2 | For explaining that both rockets have the same speed when their engines stop (4g × one halfT = 2g × T), so after cutoff both rise the same additional height. | 1 point |
| B3 | For explaining why the second rocket is lower when its engine stops, such as: it reaches the same speed in half the time, so with the same average speed it rises half as far; or the area under its velocity-time graph during the powered stage is half as large. | 1 point |
Example response
H2 < H. Both rockets are moving at 2gT when their engines stop, because 4g × one halfT = 2g × T. From that moment both are in free fall with the same speed, so each rises the same extra height. While the engines fire, each rocket speeds up steadily from 0 to 2gT, so both have the same average speed. The second rocket fires for only half as long, so it covers half the height before cutoff, and its highest point is lower. (For comparison, H2 = five halvesgT2 and H = 3gT2.)
Question 6Translation Between RepresentationsA moving walkway
6.A moving walkway of length L at an airport moves to the right with constant speed vW relative to the floor. At time t = 0, Traveler A steps onto the left end of the walkway and walks to the right with constant speed one halfvW relative to the walkway. At the same instant, Traveler B starts beside the left end of the walkway and walks along the floor to the right with constant speed one halfvW relative to the floor, as shown in the top view in Figure 1. Traveler A reaches the right end of the walkway at time t = tA.
Figure 1
Note: Figure not drawn to scale.
Part A
The velocity diagram in Figure 2 represents the velocity of the walkway relative to the floor and the velocity of Traveler A relative to the walkway.
Figure 2
Draw arrows on Figure 3 to represent the velocity of Traveler A relative to the floor and the velocity of Traveler B relative to the walkway.
- Start each arrow on the dot and point it away from the dot.
- If the velocity is zero, write “v = 0” next to the dot.
- Make the length of each arrow represent the magnitude of the velocity, using the same scale as Figure 2.
Figure 3
Part B
Derive an expression for the distance between Traveler A and Traveler B at time t = tA. Express your answer in terms of L, vW, and physical constants, as appropriate. Begin with a fundamental physics principle or an equation from the reference information.
Part C
A person who stands still on the walkway, riding along with it, measures the positions of both travelers. The person uses a position coordinate x′ that is positive to the right and equal to zero at the point on the walkway where Traveler A stepped on.
On the axes in Figure 4, draw two lines that represent x′ for Traveler A and for Traveler B as functions of time t from t = 0 to t = tA. Distinctly label each line.
Figure 4
Part D
Indicate whether the speed of Traveler A relative to Traveler B is greater than, less than, or equal to vW by writing one of the following.
- Speed of A relative to B > vW
- Speed of A relative to B < vW
- Speed of A relative to B = vW
Briefly justify your answer by referring to how velocities measured in different reference frames are related.
Review: Positive and negative velocities along a chosen axis are set up in position, velocity, and acceleration, the first section of the kinematics study guide.
Scoring guide for Question 6 (12 points)
Equivalent correct methods earn the same points. See how the scoring guides work.
| A1 | For a single arrow pointing right for Traveler A relative to the floor. | 1 point |
|---|---|---|
| A2 | For a single arrow pointing left for Traveler B relative to the walkway. | 1 point |
| A3 | For arrow lengths of six units for Traveler A relative to the floor and two units for Traveler B relative to the walkway. | 1 point |
Example response
Scoring note: A velocity measured relative to the floor equals the velocity relative to the walkway plus the walkway’s velocity relative to the floor. Traveler A: one halfvW + vW = three halvesvW, six units. Traveler B relative to the walkway: one halfvW − vW = −one halfvW, two units to the left.
| B1 | For a multistep derivation that applies x = x0 + vt to both travelers, or to the motion of Traveler A relative to Traveler B, over the time tA. | 1 point |
|---|---|---|
| B2 | For a correct velocity of Traveler A relative to the floor, three halvesvW. | 1 point |
| B3 | For a correct time tA = 2 L over 3 v sub W, or a correct position L/3 for Traveler B at that time. | 1 point |
| B4 | For a correct expression for the distance between the travelers. | 1 point |
Example response
Relative to the floor: vA = one halfvW + vW = three halvesvW and vB = one halfvW
Traveler A reaches the end when L = three halvesvWtA, so tA = 2 L over 3 v sub W
Traveler B is then at xB = one halfvWtA = L over 3
Distance between them: L − L over 3 = 2 L over 3
Scoring note: Alternate solution (relative motion): relative to Traveler B, Traveler A moves at three halvesvW − one halfvW = vW. The travelers start side by side, so at tA = 2 L over 3 v sub W they are vWtA = 2 L over 3 apart. This earns all four points.
Scoring note: The answer does not depend on vW. A faster walkway shortens the time Traveler A needs to reach the end, and the gap between the travelers grows faster by the same factor.
| C1 | For a straight line through the origin with positive slope, labeled A. | 1 point |
|---|---|---|
| C2 | For a straight line through the origin with negative slope, labeled B. | 1 point |
| C3 | For lines that end at x′ = L/3 (A) and x′ = −L/3 (B) at t = tA. | 1 point |
Example response
Key
| D1 | For indicating that the speed of Traveler A relative to Traveler B equals vW. | 1 point |
|---|---|---|
| D2 | For a valid justification, such as: relative to the floor, A moves at three halvesvW and B at one halfvW, so A gains on B at vW; or each traveler walks at one halfvW relative to the surface underfoot, so their velocities differ by the walkway’s velocity. | 1 point |
Example response
Equal to vW. Velocities measured in two frames differ by the velocity of one frame relative to the other. Each traveler walks at one halfvW relative to the surface under their feet, so the only difference between their velocities is the walkway’s velocity, vW. The graph in Part C shows the same thing: relative to the walkway, A moves at +one halfvW and B at −one halfvW, a difference of vW. It also matches Part B, since a gap that grows at vW for a time 2 L over 3 v sub W reaches 2 L over 3.
Question 7Experimental Design and AnalysisA ball launcher
The following information applies to Parts A and B.
7.Students want to determine the launch speed vL of a small ball fired by a spring-loaded launcher. The launcher fires the ball horizontally and gives it the same launch speed every time. The launcher can be clamped to the edge of tables of different heights, and a sheet of carbon paper on the floor marks where the ball lands, as shown in Figure 1.
Figure 1
Note: Figure not drawn to scale.
The students must design an experiment in which they vary one quantity and collect data that can be graphed to determine vL. The only measuring tool available is a meterstick.
Part A
Indicate the quantities the students should measure so that they can determine vL from a linear graph.
Briefly describe one way the students could reduce the experimental uncertainty in these measurements.
Part B
Indicate the quantities the students could plot on the horizontal and vertical axes to produce a linear graph from which vL can be determined. State clearly which quantity goes on each axis.
Briefly describe how vL is related to a feature of the graph from Part B(i). You may include an equation that relates vL to that feature.
The following information applies to Parts C and D.
In a different experiment, the students place the same launcher on the floor and fire the ball at several angles θ above the horizontal. For each angle, they set the top of a level platform at the height where the ball leaves the launcher, so the ball lands at the same height from which it was launched, as shown in Figure 2. The students measure the horizontal distance R from the launch point to the landing point. Table 1 shows the data.
Figure 2
Note: Figure not drawn to scale.
Table 1
| θ (degrees) | R (m) |
|---|---|
| 10 | 0.32 |
| 15 | 0.45 |
| 20 | 0.60 |
| 25 | 0.70 |
| 30 | 0.78 |
| 35 | 0.87 |
The students correctly determine that R = v sub L squared over g sin 2θ. The students make a graph with R plotted on the horizontal axis.
Part C
Label the vertical axis of Figure 3 with a measured or calculated quantity, with units if it has any. Choose a quantity that makes the graph linear and lets you determine vL.
On the grid in Figure 3, make a graph that can be used to determine vL.
- Add a numerical scale to the vertical axis.
- Plot the data points.
- Work out the values you plot on scratch paper.
Figure 3
Draw a best-fit line through the data you plotted in Part C(ii).
Part D
Use your best-fit line from Part C(iii) to calculate an experimental value for vL.
Review: The horizontal launch in Parts A and B is the same setup as the worked example of a ball rolling off a platform in the kinematics study guide.
Scoring guide for Question 7 (10 points)
Equivalent correct methods earn the same points. See how the scoring guides work.
| A(i) | For indicating that the students measure the launch height h (from the floor to the ball as it leaves the launcher) and the horizontal distance D from the point on the floor directly below the launch point to the landing mark, for several table heights. | 1 point |
|---|---|---|
| A(ii) | For a valid way to reduce uncertainty, such as firing several times at each height and averaging the landing distances, or measuring D to the center of the cluster of marks. | 1 point |
| B(i) | For a pair of quantities that gives a linear graph, such as D2 on the vertical axis and h on the horizontal axis. | 1 point |
|---|---|---|
| B(ii) | For relating a feature of the graph to vL, such as: for D2 versus h, the slope equals 2 v sub L squared over g, so vL = √(g × slope ÷ 2). | 1 point |
Example response
The fall time comes from h = one halfgt2, and the horizontal distance is D = vLt. Eliminating t gives D2 = 2 v sub L squared over gh. A graph of D2 (vertical axis) versus h (horizontal axis) is a straight line through the origin, and vL = √(g × slope ÷ 2).
Scoring note: D versus √h also works, with slope = vL√(2/g).
| C(i) | For labeling the vertical axis with a quantity that makes the graph linear with R on the horizontal axis, such as sin 2θ (no units) or (sin 2θ)/g in s2/m. | 1 point |
|---|---|---|
| C(ii) | For a linear numerical scale on the vertical axis. | 1 point |
| C(iii) | For plotting the six data points correctly for the chosen quantity. | 1 point |
| C(iv) | For a straight best-fit line that follows the trend of the data, with points on both sides of the line. | 1 point |
Example response
Key
Values plotted
| θ (degrees) | sin 2θ | R (m) |
|---|---|---|
| 10 | 0.342 | 0.32 |
| 15 | 0.500 | 0.45 |
| 20 | 0.643 | 0.60 |
| 25 | 0.766 | 0.70 |
| 30 | 0.866 | 0.78 |
| 35 | 0.940 | 0.87 |
| D(i) | For relating the slope to vL correctly for the quantity plotted in Part C. For sin 2θ versus R, the slope is g over v sub L squared, so vL = √(g ÷ slope). For (sin 2θ)/g versus R, the slope is 1 over v sub L squared, so vL = 1 ÷ √slope. | 1 point |
|---|---|---|
| D(ii) | For a value of vL between 2.85 m/s and 3.15 m/s. | 1 point |
Example response
Rearranging R = v sub L squared over g sin 2θ gives sin 2θ = g over v sub L squaredR, so the slope of the graph is g over v sub L squared.
Two points on the best-fit line: (0.20 m, 0.22) and (0.90 m, 0.98)
slope = (0.98 − 0.22) ÷ (0.90 m − 0.20 m) = 1.09 m−1
vL = √(9.8 m/s2 ÷ 1.09 m−1) = 3.0 m/s
Scoring note: A student who plotted (sin 2θ)/g reads a slope of about 0.11 s2/m2, which gives vL = 1 ÷ √0.11 = 3.0 m/s and earns both points.
Question 8Qualitative/Quantitative TranslationStopping distance
8.A driver traveling at constant speed on a straight, level road sees an obstacle ahead. During the driver’s reaction time tr, the car keeps moving at the same constant speed. The driver then applies the brakes, and the car slows down with constant acceleration of magnitude a0 until it stops, as shown in Figure 1. The total stopping distance is the distance the car travels from the instant the driver sees the obstacle until the car stops.
Figure 1
Note: Figure not drawn to scale.
Car A travels at speed v before its driver sees the obstacle, and Car B travels at speed 2v. Both drivers have the same reaction time tr, and both cars slow down with acceleration of the same magnitude a0. The total stopping distances of Car A and Car B are dA and dB, respectively.
Part A
Indicate whether dB is greater than, less than, or equal to 2dA by writing one of the following.
- dB > 2dA
- dB < 2dA
- dB = 2dA
Justify your answer in words, without relying on equations.
Part B
Starting with a kinematic equation or the work-energy theorem, derive an expression for dA. Express your answer in terms of v, tr, a0, and physical constants, as appropriate. Begin with a fundamental physics principle or an equation from the reference information.
Part C
Justify whether your expression from Part B is consistent with your reasoning in Part A.
Review: The braking stage uses the equation that leaves out time, listed with the other constant-acceleration equations in the kinematics study guide.
Scoring guide for Question 8 (8 points)
Equivalent correct methods earn the same points. See how the scoring guides work.
| A1 | For indicating dB > 2dA. | 1 point |
|---|---|---|
| A2 | For explaining that Car B has twice as much speed to lose at the same rate, so it brakes for twice as long as Car A. | 1 point |
| A3 | For explaining that Car B’s average speed while braking is also twice Car A’s, so its braking distance is four times as large; with the reaction distance only doubled, the total more than doubles. | 1 point |
Example response
dB > 2dA. During the reaction time both cars move at constant speed for the same time, so Car B goes twice as far. While braking, both cars lose speed at the same rate. Car B has twice as much speed to lose, so it brakes for twice as long, and its average speed while braking is also twice as large. Twice the average speed for twice the time gives four times the braking distance, so the total is more than twice Car A’s.
Scoring note: Reasoning about energy also earns points A2 and A3, for example: each kilogram of Car B has four times as much kinetic energy to remove, and braking removes the same energy per kilogram for each meter traveled, so Car B’s braking distance is four times Car A’s.
| B1 | For a multistep derivation that treats the reaction interval (constant speed) and the braking interval (constant acceleration) separately. | 1 point |
|---|---|---|
| B2 | For a correct reaction distance vtr or a correct braking distance v squared over 2 a sub 0. | 1 point |
| B3 | For a correct expression for dA. | 1 point |
Example response
Reaction: Δx1 = vtr
Braking, with final speed 0 and ax = −a0: vx2 = vx02 + 2axΔx → 0 = v2 − 2a0Δx2, so Δx2 = v squared over 2 a sub 0
dA = vtr + v squared over 2 a sub 0
Scoring note: Alternate solution (work-energy theorem): during braking the net force on the car has magnitude ma0, so −ma0Δx2 = 0 − one halfmv2, which gives Δx2 = v squared over 2 a sub 0. The mass cancels.
| C1 | For describing the functional dependence: the reaction distance is proportional to the speed, and the braking distance is proportional to the square of the speed. | 1 point |
|---|---|---|
| C2 | For applying it: doubling the speed doubles the first term and quadruples the second, so dB exceeds 2dA, which agrees with Part A. | 1 point |
Example response
dB = (2v)tr + 2 v squared over 2 a sub 0 = 2vtr + 2 v squared over a sub 0
2dA = 2vtr + v squared over a sub 0
dB − 2dA = v squared over a sub 0 > 0, consistent with Part A.
Free printable · No signup
AP Physics 1 kinematics FRQ practice PDF
The PDF follows the layout of the exam booklet: a directions page, Questions 1 to 8 with their figures and blank graph grids, and the scoring guidelines at the back, starting on page 20. It is sized for US Letter. Teachers and study groups are welcome to print and distribute it in class. A link back to this page is appreciated but not required.
Keep going with Unit 1
For more problems on the same topics, the kinematics study guide has 24 practice problems with answers and a one-page kinematics cheat sheet, and the free fall guide adds 27 free fall practice problems. Turkish-language versions of the kinematics material are also available: AP Physics 1 Kinematik: Konu Anlatımı and Hareket Grafikleri.
Working through AP Physics 1 free-response questions with a tutor
I tutor AP Physics 1 in person across Fremont, Newark, and Union City. A session on free-response questions can focus on starting derivations from the reference sheet, sketching graphs with the right shape in each stage of the motion, and writing justifications that name the physics behind each claim. Bring a recent test or a set of FRQs from class so we can start from the parts that cost you points.
Call or text to talk about your student’s class.
(510) 453-0350Serving Fremont, Newark, and Union City. AP coursework is priced separately from standard in-home subjects. See class rates.
About these questions
These are original practice questions written for this page, not released exam questions. They cover AP Physics 1 Unit 1 (topics 1.1 to 1.5) and follow the free-response formats and point totals of the 2026 exam. The lab data in Questions 3 and 7 were constructed for practice. This page is an independent study resource. AP is a trademark registered by the College Board, which is not affiliated with and does not endorse this resource.